class: center, middle, inverse, title-slide # Visualisation ## Drawing maps ### Marie-Pierre Etienne ### <a href="https://marieetienne.github.io/" class="uri">https://marieetienne.github.io/</a> ### 2020/09/11 (updated: 2022-10-28) --- --- # Des sources d'inspirations - [Drawing beautiful maps programmatically](https://www.r-spatial.org/r/2018/10/25/ggplot2-sf.html) - [StanMap](https://statnmap.com/fr/gallery/) (un ancien d'Agrocampus Ouest) - [Geocomputation with R](https://geocompr.robinlovelace.net/) - [Leaflet introduction](https://rstudio.github.io/leaflet/) --- # Drawing a simple map with ggmap Get free maps thanks to OpenStreetMap through the `osmdata` package ( [vignette available](https://cran.r-project.org/web/packages/osmdata/vignettes/osmdata.html) ) ```r library('tidyverse') library('ggplot2') ##remotes::install_github("ropensci/osmdata") rennes_bb <- osmdata::getbb('Rennes') %>% as.numeric() ##get bounding box rennes_bb ``` ``` ## [1] -1.752588 48.076915 -1.624405 48.154970 ``` ```r bat24 <- data.frame(lat= 48.114072, lon = -1.710184, text = 'Batiment 24') zone_map <- ggmap::get_stamenmap(bbox = rennes_bb, zoom = 13) ``` ``` ## Source : http://tile.stamen.com/terrain/13/4056/2842.png ``` ``` ## Source : http://tile.stamen.com/terrain/13/4057/2842.png ``` ``` ## Source : http://tile.stamen.com/terrain/13/4058/2842.png ``` ``` ## Source : http://tile.stamen.com/terrain/13/4059/2842.png ``` ``` ## Source : http://tile.stamen.com/terrain/13/4056/2843.png ``` ``` ## Source : http://tile.stamen.com/terrain/13/4057/2843.png ``` ``` ## Source : http://tile.stamen.com/terrain/13/4058/2843.png ``` ``` ## Source : http://tile.stamen.com/terrain/13/4059/2843.png ``` ``` ## Source : http://tile.stamen.com/terrain/13/4056/2844.png ``` ``` ## Source : http://tile.stamen.com/terrain/13/4057/2844.png ``` ``` ## Source : http://tile.stamen.com/terrain/13/4058/2844.png ``` ``` ## Source : http://tile.stamen.com/terrain/13/4059/2844.png ``` ``` ## Source : http://tile.stamen.com/terrain/13/4056/2845.png ``` ``` ## Source : http://tile.stamen.com/terrain/13/4057/2845.png ``` ``` ## Source : http://tile.stamen.com/terrain/13/4058/2845.png ``` ``` ## Source : http://tile.stamen.com/terrain/13/4059/2845.png ``` ```r zone_map %>% ggmap::ggmap() + geom_point(data = bat24, aes(x= lon, y = lat), col = 'red') + geom_text(data = bat24, aes(x= lon, y = lat, label = text), hjust = 0.1, nudge_x = 0.004, col = 'red' ) ``` ```r ##remotes::install_github("ropensci/osmdata") rennes_bb <- osmdata::getbb('Rennes') %>% as.numeric() ##get bounding box bat24 <- data.frame(lat= 48.114072, lon = -1.710184, text = 'Batiment 24') zone_map <- ggmap::get_stamenmap(bbox = rennes_bb, zoom = 13) zone_map %>% ggmap::ggmap() + geom_point(data = bat24, aes(x= lon, y = lat), col = 'red') + geom_text(data = bat24, aes(x= lon, y = lat, label = text), hjust = 0.1, nudge_x = 0.004, col = 'red' ) ``` --- count: false .panel1-openstreetmap_package-auto[ ```r *library('tidyverse') ``` ] .panel2-openstreetmap_package-auto[ ] --- count: false .panel1-openstreetmap_package-auto[ ```r library('tidyverse') *library('ggplot2') ``` ] .panel2-openstreetmap_package-auto[ ] --- count: false .panel1-openstreetmap_package-auto[ ```r library('tidyverse') library('ggplot2') *##remotes::install_github("ropensci/osmdata") ##remotes::install_github("ropensci/osmdata") ``` ] .panel2-openstreetmap_package-auto[ ] --- count: false .panel1-openstreetmap_package-auto[ ```r library('tidyverse') library('ggplot2') ##remotes::install_github("ropensci/osmdata") ##remotes::install_github("ropensci/osmdata") *rennes_bb <- osmdata::getbb('Rennes') ``` ] .panel2-openstreetmap_package-auto[ ] --- count: false .panel1-openstreetmap_package-auto[ ```r library('tidyverse') library('ggplot2') ##remotes::install_github("ropensci/osmdata") ##remotes::install_github("ropensci/osmdata") rennes_bb <- osmdata::getbb('Rennes') %>% * as.numeric() ##get bounding box ``` ] .panel2-openstreetmap_package-auto[ ] --- count: false .panel1-openstreetmap_package-auto[ ```r library('tidyverse') library('ggplot2') ##remotes::install_github("ropensci/osmdata") ##remotes::install_github("ropensci/osmdata") rennes_bb <- osmdata::getbb('Rennes') %>% as.numeric() ##get bounding box *rennes_bb ``` ] .panel2-openstreetmap_package-auto[ ``` ## [1] -1.752588 48.076915 -1.624405 48.154970 ``` ] --- count: false .panel1-openstreetmap_package-auto[ ```r library('tidyverse') library('ggplot2') ##remotes::install_github("ropensci/osmdata") ##remotes::install_github("ropensci/osmdata") rennes_bb <- osmdata::getbb('Rennes') %>% as.numeric() ##get bounding box rennes_bb *bat24 <- data.frame(lat= 48.114072, lon = -1.710184, * text = 'Batiment 24') ``` ] .panel2-openstreetmap_package-auto[ ``` ## [1] -1.752588 48.076915 -1.624405 48.154970 ``` ] --- count: false .panel1-openstreetmap_package-auto[ ```r library('tidyverse') library('ggplot2') ##remotes::install_github("ropensci/osmdata") ##remotes::install_github("ropensci/osmdata") rennes_bb <- osmdata::getbb('Rennes') %>% as.numeric() ##get bounding box rennes_bb bat24 <- data.frame(lat= 48.114072, lon = -1.710184, text = 'Batiment 24') *zone_map <- ggmap::get_stamenmap(bbox = rennes_bb, * zoom = 13) ``` ] .panel2-openstreetmap_package-auto[ ``` ## [1] -1.752588 48.076915 -1.624405 48.154970 ``` ] --- count: false .panel1-openstreetmap_package-auto[ ```r library('tidyverse') library('ggplot2') ##remotes::install_github("ropensci/osmdata") ##remotes::install_github("ropensci/osmdata") rennes_bb <- osmdata::getbb('Rennes') %>% as.numeric() ##get bounding box rennes_bb bat24 <- data.frame(lat= 48.114072, lon = -1.710184, text = 'Batiment 24') zone_map <- ggmap::get_stamenmap(bbox = rennes_bb, zoom = 13) *zone_map ``` ] .panel2-openstreetmap_package-auto[ ``` ## [1] -1.752588 48.076915 -1.624405 48.154970 ``` ``` ## 682x746 terrain map image from Stamen Maps. ## See ?ggmap to plot it. ``` ] --- count: false .panel1-openstreetmap_package-auto[ ```r library('tidyverse') library('ggplot2') ##remotes::install_github("ropensci/osmdata") ##remotes::install_github("ropensci/osmdata") rennes_bb <- osmdata::getbb('Rennes') %>% as.numeric() ##get bounding box rennes_bb bat24 <- data.frame(lat= 48.114072, lon = -1.710184, text = 'Batiment 24') zone_map <- ggmap::get_stamenmap(bbox = rennes_bb, zoom = 13) zone_map %>% * ggmap::ggmap() ``` ] .panel2-openstreetmap_package-auto[ ``` ## [1] -1.752588 48.076915 -1.624405 48.154970 ``` 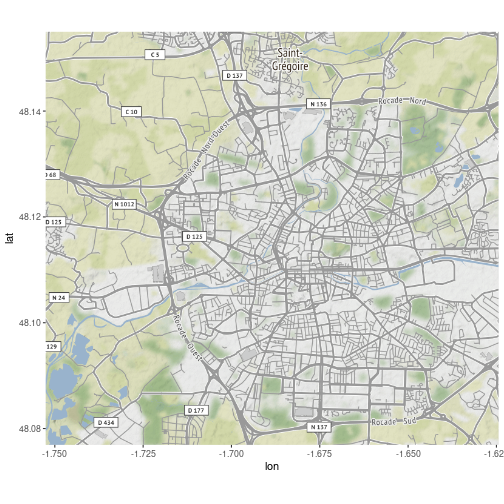<!-- --> ] --- count: false .panel1-openstreetmap_package-auto[ ```r library('tidyverse') library('ggplot2') ##remotes::install_github("ropensci/osmdata") ##remotes::install_github("ropensci/osmdata") rennes_bb <- osmdata::getbb('Rennes') %>% as.numeric() ##get bounding box rennes_bb bat24 <- data.frame(lat= 48.114072, lon = -1.710184, text = 'Batiment 24') zone_map <- ggmap::get_stamenmap(bbox = rennes_bb, zoom = 13) zone_map %>% ggmap::ggmap() + * geom_point(data = bat24, aes(x= lon, y = lat), col = 'red') ``` ] .panel2-openstreetmap_package-auto[ ``` ## [1] -1.752588 48.076915 -1.624405 48.154970 ``` 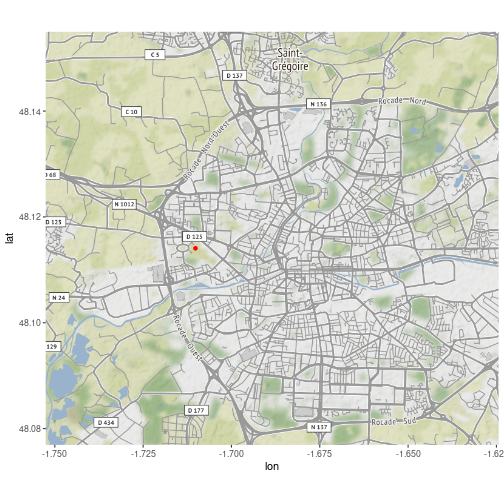<!-- --> ] --- count: false .panel1-openstreetmap_package-auto[ ```r library('tidyverse') library('ggplot2') ##remotes::install_github("ropensci/osmdata") ##remotes::install_github("ropensci/osmdata") rennes_bb <- osmdata::getbb('Rennes') %>% as.numeric() ##get bounding box rennes_bb bat24 <- data.frame(lat= 48.114072, lon = -1.710184, text = 'Batiment 24') zone_map <- ggmap::get_stamenmap(bbox = rennes_bb, zoom = 13) zone_map %>% ggmap::ggmap() + geom_point(data = bat24, aes(x= lon, y = lat), col = 'red') + * geom_text(data = bat24, aes(x= lon, y = lat, label = text), hjust = 0.1, nudge_x = 0.004, col = 'red' ) ``` ] .panel2-openstreetmap_package-auto[ ``` ## [1] -1.752588 48.076915 -1.624405 48.154970 ``` 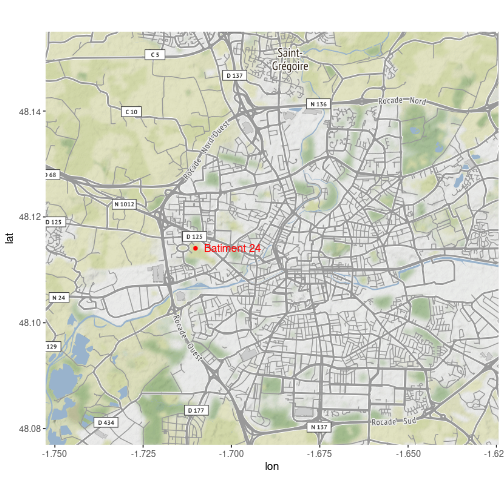<!-- --> ] <style> .panel1-openstreetmap_package-auto { color: black; width: 38.6060606060606%; hight: 32%; float: left; padding-left: 1%; font-size: 80% } .panel2-openstreetmap_package-auto { color: black; width: 59.3939393939394%; hight: 32%; float: left; padding-left: 1%; font-size: 80% } .panel3-openstreetmap_package-auto { color: black; width: NA%; hight: 33%; float: left; padding-left: 1%; font-size: 80% } </style> --- name: data_type # Data types --- template: data_type ## Raster data Basically image ( a matrix where a cell represents a pixel) ```r class(zone_map) ``` ``` ## [1] "ggmap" "raster" ``` For simple plots only, difficult to transform -- ## Vector data - Vector data are collections of points, lines, polygons (potentially connected). - Many different objects in `R` deals with spatial data .highlight[focus on ` sf` objects] Many possible operation (intersection, union, buffer, etc ....) Two main formats in R : [sp](https://cran.r-project.org/web/packages/sp/sp.pdf) and [sf](https://cran.r-project.org/web/packages/sf/sf.pdf) --- template: data_type ## Vector data ### sf package Simple features (`sf`) is an [open standard](https://www.ogc.org/standards/sfa) for spatial object with hierarchical structure. The package extends the data.frame format to account for a geometry column. The `sf` package provides - efficient access to data (writing and reading) - easy and fancy plotting - `sf` objects can be used as `data.frame` --- template: data_type ## Vector data ### `sf` objects example ```r library("sf") ``` ``` ## Linking to GEOS 3.8.0, GDAL 3.0.4, PROJ 6.3.1 ``` ```r library("rnaturalearth") library("rnaturalearthdata") world <- ne_countries(scale = "medium", returnclass = "sf") ``` --- template: data_type ```r world %>% select(admin, income_grp, wikipedia, economy, geometry) %>% print(n=5) ``` ``` ## Simple feature collection with 241 features and 4 fields ## geometry type: MULTIPOLYGON ## dimension: XY ## bbox: xmin: -180 ymin: -89.99893 xmax: 180 ymax: 83.59961 ## CRS: +proj=longlat +datum=WGS84 +no_defs +ellps=WGS84 +towgs84=0,0,0 ## First 5 features: ## admin income_grp wikipedia economy ## 0 Aruba 2. High income: nonOECD NA 6. Developing region ## 1 Afghanistan 5. Low income NA 7. Least developed region ## 2 Angola 3. Upper middle income NA 7. Least developed region ## 3 Anguilla 3. Upper middle income NA 6. Developing region ## 4 Albania 4. Lower middle income NA 6. Developing region ## geometry ## 0 MULTIPOLYGON (((-69.89912 1... ## 1 MULTIPOLYGON (((74.89131 37... ## 2 MULTIPOLYGON (((14.19082 -5... ## 3 MULTIPOLYGON (((-63.00122 1... ## 4 MULTIPOLYGON (((20.06396 42... ``` --- template: data_type ```r st_crs(world ) ``` ``` ## Coordinate Reference System: ## User input: +proj=longlat +datum=WGS84 +no_defs +ellps=WGS84 +towgs84=0,0,0 ## wkt: ## BOUNDCRS[ ## SOURCECRS[ ## GEOGCRS["unknown", ## DATUM["World Geodetic System 1984", ## ELLIPSOID["WGS 84",6378137,298.257223563, ## LENGTHUNIT["metre",1]], ## ID["EPSG",6326]], ## PRIMEM["Greenwich",0, ## ANGLEUNIT["degree",0.0174532925199433], ## ID["EPSG",8901]], ## CS[ellipsoidal,2], ## AXIS["longitude",east, ## ORDER[1], ## ANGLEUNIT["degree",0.0174532925199433, ## ID["EPSG",9122]]], ## AXIS["latitude",north, ## ORDER[2], ## ANGLEUNIT["degree",0.0174532925199433, ## ID["EPSG",9122]]]]], ## TARGETCRS[ ## GEOGCRS["WGS 84", ## DATUM["World Geodetic System 1984", ## ELLIPSOID["WGS 84",6378137,298.257223563, ## LENGTHUNIT["metre",1]]], ## PRIMEM["Greenwich",0, ## ANGLEUNIT["degree",0.0174532925199433]], ## CS[ellipsoidal,2], ## AXIS["latitude",north, ## ORDER[1], ## ANGLEUNIT["degree",0.0174532925199433]], ## AXIS["longitude",east, ## ORDER[2], ## ANGLEUNIT["degree",0.0174532925199433]], ## ID["EPSG",4326]]], ## ABRIDGEDTRANSFORMATION["Transformation from unknown to WGS84", ## METHOD["Geocentric translations (geog2D domain)", ## ID["EPSG",9603]], ## PARAMETER["X-axis translation",0, ## ID["EPSG",8605]], ## PARAMETER["Y-axis translation",0, ## ID["EPSG",8606]], ## PARAMETER["Z-axis translation",0, ## ID["EPSG",8607]]]] ``` --- name: coordinate_header # Coordinate Reference system (CRS) --- template: coordinate_header From spherical object to maps ## Geodetic datum (or geodetic system) An approximation of sea level on Earth contains: - the definition of the chosen ellipsoide - a geodetic datum on Earth ```r knitr::include_graphics("1280px-ECEF.png") ``` <div class="figure"> <img src="1280px-ECEF.png" alt="Geodetic datum (source https://commons.wikimedia.org/wiki/File:Azimutalprojektion-schief_kl.jpg, author: Stefan Kühn, Fotograf )" width="40%" /> <p class="caption">Geodetic datum (source https://commons.wikimedia.org/wiki/File:Azimutalprojektion-schief_kl.jpg, author: Stefan Kühn, Fotograf )</p> </div> At global scale *World Geodetic System* (WGS84) is the reference geodetic datum for GPS --- template: coordinate_header ## Projected CRS - Cartesian coordinates on flat surface, - based on a geodetic datum - rely on on map projection to convert the 3d surface on Earth into Eastings and Northings (x and y) --- template: coordinate_header ## Effects of projection ### WGS84 representation ```r world %>% filter(brk_name == "United States") %>% ggplot() + geom_sf() ``` 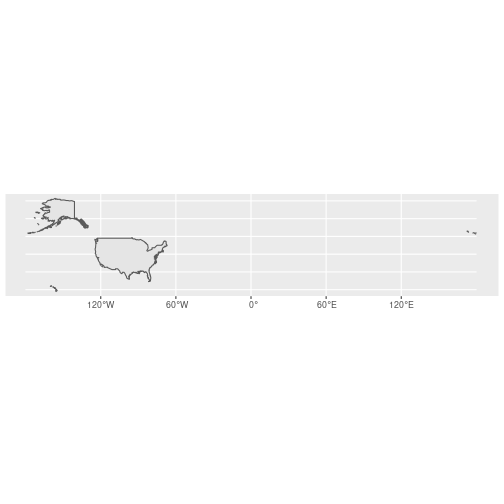<!-- --> --- template: coordinate_header ## Effects of projection ### US National Atlas Equal Area ```r world %>% filter(brk_name == "United States") %>% st_transform(crs = 2163) %>% ggplot() + geom_sf() ``` 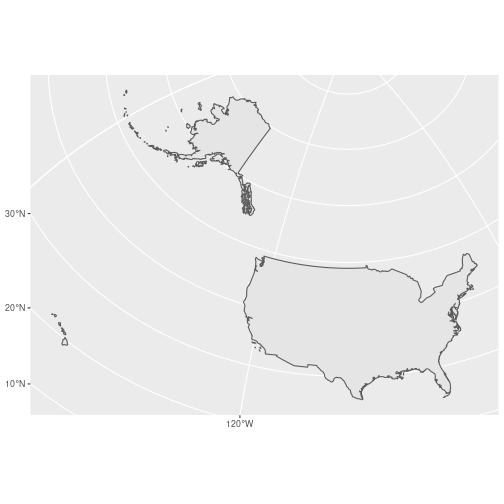<!-- --> --- template: coordinate_header ### Focus on France ```r france_dta <- world %>% filter(name == 'France') st_crs(france_dta) ``` ``` ## Coordinate Reference System: ## User input: +proj=longlat +datum=WGS84 +no_defs +ellps=WGS84 +towgs84=0,0,0 ## wkt: ## BOUNDCRS[ ## SOURCECRS[ ## GEOGCRS["unknown", ## DATUM["World Geodetic System 1984", ## ELLIPSOID["WGS 84",6378137,298.257223563, ## LENGTHUNIT["metre",1]], ## ID["EPSG",6326]], ## PRIMEM["Greenwich",0, ## ANGLEUNIT["degree",0.0174532925199433], ## ID["EPSG",8901]], ## CS[ellipsoidal,2], ## AXIS["longitude",east, ## ORDER[1], ## ANGLEUNIT["degree",0.0174532925199433, ## ID["EPSG",9122]]], ## AXIS["latitude",north, ## ORDER[2], ## ANGLEUNIT["degree",0.0174532925199433, ## ID["EPSG",9122]]]]], ## TARGETCRS[ ## GEOGCRS["WGS 84", ## DATUM["World Geodetic System 1984", ## ELLIPSOID["WGS 84",6378137,298.257223563, ## LENGTHUNIT["metre",1]]], ## PRIMEM["Greenwich",0, ## ANGLEUNIT["degree",0.0174532925199433]], ## CS[ellipsoidal,2], ## AXIS["latitude",north, ## ORDER[1], ## ANGLEUNIT["degree",0.0174532925199433]], ## AXIS["longitude",east, ## ORDER[2], ## ANGLEUNIT["degree",0.0174532925199433]], ## ID["EPSG",4326]]], ## ABRIDGEDTRANSFORMATION["Transformation from unknown to WGS84", ## METHOD["Geocentric translations (geog2D domain)", ## ID["EPSG",9603]], ## PARAMETER["X-axis translation",0, ## ID["EPSG",8605]], ## PARAMETER["Y-axis translation",0, ## ID["EPSG",8606]], ## PARAMETER["Z-axis translation",0, ## ID["EPSG",8607]]]] ``` ```r france_dta%>% ggplot() + geom_sf() ``` 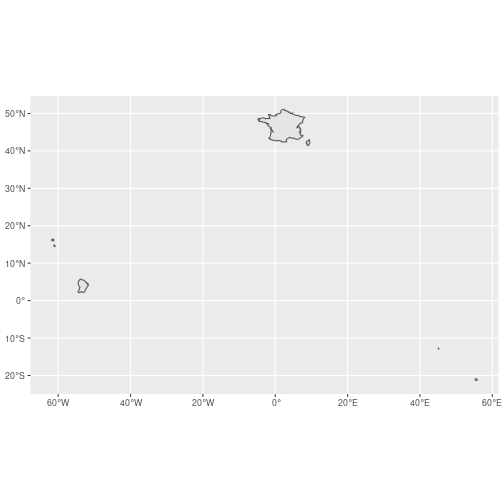<!-- --> --- count: false .panel1-sf_france_example_map-auto[ ```r *france_dta <- world %>% filter(name == 'France') ``` ] .panel2-sf_france_example_map-auto[ ] --- count: false .panel1-sf_france_example_map-auto[ ```r france_dta <- world %>% filter(name == 'France') *st_crs(france_dta) ``` ] .panel2-sf_france_example_map-auto[ ``` ## Coordinate Reference System: ## User input: +proj=longlat +datum=WGS84 +no_defs +ellps=WGS84 +towgs84=0,0,0 ## wkt: ## BOUNDCRS[ ## SOURCECRS[ ## GEOGCRS["unknown", ## DATUM["World Geodetic System 1984", ## ELLIPSOID["WGS 84",6378137,298.257223563, ## LENGTHUNIT["metre",1]], ## ID["EPSG",6326]], ## PRIMEM["Greenwich",0, ## ANGLEUNIT["degree",0.0174532925199433], ## ID["EPSG",8901]], ## CS[ellipsoidal,2], ## AXIS["longitude",east, ## ORDER[1], ## ANGLEUNIT["degree",0.0174532925199433, ## ID["EPSG",9122]]], ## AXIS["latitude",north, ## ORDER[2], ## ANGLEUNIT["degree",0.0174532925199433, ## ID["EPSG",9122]]]]], ## TARGETCRS[ ## GEOGCRS["WGS 84", ## DATUM["World Geodetic System 1984", ## ELLIPSOID["WGS 84",6378137,298.257223563, ## LENGTHUNIT["metre",1]]], ## PRIMEM["Greenwich",0, ## ANGLEUNIT["degree",0.0174532925199433]], ## CS[ellipsoidal,2], ## AXIS["latitude",north, ## ORDER[1], ## ANGLEUNIT["degree",0.0174532925199433]], ## AXIS["longitude",east, ## ORDER[2], ## ANGLEUNIT["degree",0.0174532925199433]], ## ID["EPSG",4326]]], ## ABRIDGEDTRANSFORMATION["Transformation from unknown to WGS84", ## METHOD["Geocentric translations (geog2D domain)", ## ID["EPSG",9603]], ## PARAMETER["X-axis translation",0, ## ID["EPSG",8605]], ## PARAMETER["Y-axis translation",0, ## ID["EPSG",8606]], ## PARAMETER["Z-axis translation",0, ## ID["EPSG",8607]]]] ``` ] --- count: false .panel1-sf_france_example_map-auto[ ```r france_dta <- world %>% filter(name == 'France') st_crs(france_dta) *france_dta%>% ggplot() + geom_sf() ``` ] .panel2-sf_france_example_map-auto[ ``` ## Coordinate Reference System: ## User input: +proj=longlat +datum=WGS84 +no_defs +ellps=WGS84 +towgs84=0,0,0 ## wkt: ## BOUNDCRS[ ## SOURCECRS[ ## GEOGCRS["unknown", ## DATUM["World Geodetic System 1984", ## ELLIPSOID["WGS 84",6378137,298.257223563, ## LENGTHUNIT["metre",1]], ## ID["EPSG",6326]], ## PRIMEM["Greenwich",0, ## ANGLEUNIT["degree",0.0174532925199433], ## ID["EPSG",8901]], ## CS[ellipsoidal,2], ## AXIS["longitude",east, ## ORDER[1], ## ANGLEUNIT["degree",0.0174532925199433, ## ID["EPSG",9122]]], ## AXIS["latitude",north, ## ORDER[2], ## ANGLEUNIT["degree",0.0174532925199433, ## ID["EPSG",9122]]]]], ## TARGETCRS[ ## GEOGCRS["WGS 84", ## DATUM["World Geodetic System 1984", ## ELLIPSOID["WGS 84",6378137,298.257223563, ## LENGTHUNIT["metre",1]]], ## PRIMEM["Greenwich",0, ## ANGLEUNIT["degree",0.0174532925199433]], ## CS[ellipsoidal,2], ## AXIS["latitude",north, ## ORDER[1], ## ANGLEUNIT["degree",0.0174532925199433]], ## AXIS["longitude",east, ## ORDER[2], ## ANGLEUNIT["degree",0.0174532925199433]], ## ID["EPSG",4326]]], ## ABRIDGEDTRANSFORMATION["Transformation from unknown to WGS84", ## METHOD["Geocentric translations (geog2D domain)", ## ID["EPSG",9603]], ## PARAMETER["X-axis translation",0, ## ID["EPSG",8605]], ## PARAMETER["Y-axis translation",0, ## ID["EPSG",8606]], ## PARAMETER["Z-axis translation",0, ## ID["EPSG",8607]]]] ``` <!-- --> ] <style> .panel1-sf_france_example_map-auto { color: black; width: 38.6060606060606%; hight: 32%; float: left; padding-left: 1%; font-size: 80% } .panel2-sf_france_example_map-auto { color: black; width: 59.3939393939394%; hight: 32%; float: left; padding-left: 1%; font-size: 80% } .panel3-sf_france_example_map-auto { color: black; width: NA%; hight: 33%; float: left; padding-left: 1%; font-size: 80% } </style> --- template: coordinate_header ### Focus on Metropolitan France Change of WGS84 ```r metro_dta <- france_dta %>% st_crop( xmin = -5, xmax = 11, ymin= 40.6, ymax = 52) ``` ``` ## although coordinates are longitude/latitude, st_intersection assumes that they are planar ``` ``` ## Warning: attribute variables are assumed to be spatially constant throughout all ## geometries ``` ```r metro_dta %>% ggplot() + geom_sf() ``` 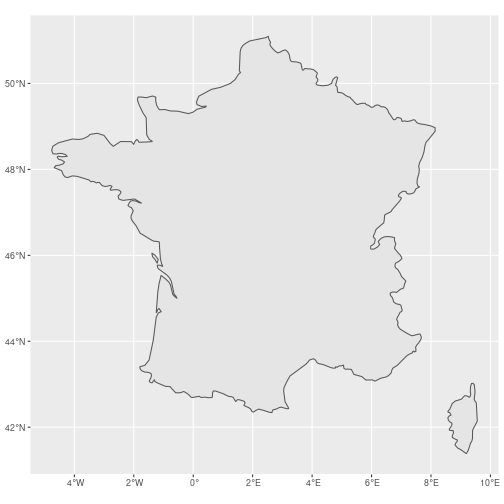<!-- --> --- template: coordinate_header ### Focus on Metropolitan France Change of CRS for Lambert 93 ```r metro_dta %>% st_transform( crs = 2154 ) %>% ggplot() + geom_sf() ``` 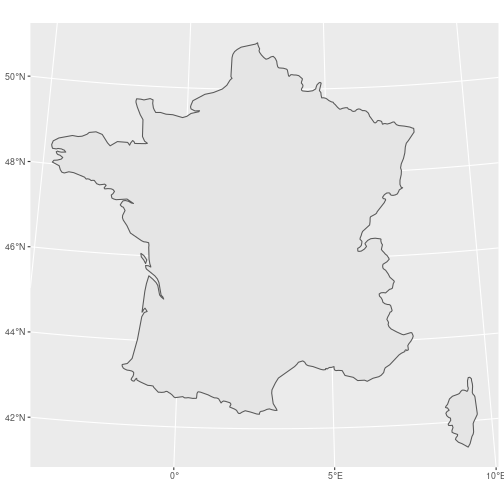<!-- --> --- template: coordinate_header ### Focus on Metropolitan France Change of CRS for UTM31N ```r metro_dta %>% st_transform( crs = 32631 ) %>% ggplot() + geom_sf() ``` 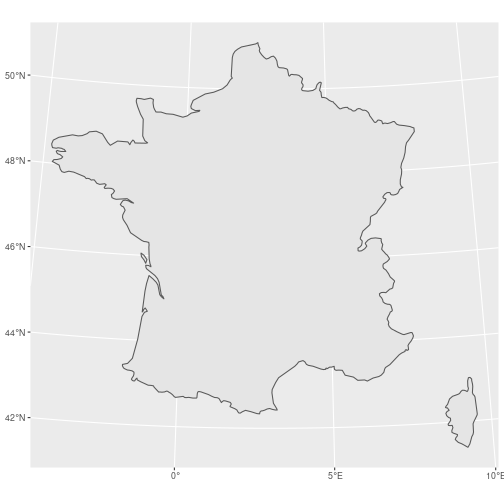<!-- --> --- name: sf # Simple features geometry --- template: sf ## Geometry types - Vector data are collections of points, lines, polygons (potentially connected). - Many different objects in `R` deals with spatial data. focus on ` sf` objects} Simple features (`sf`) is an [open standard](https://www.ogc.org/standards/sfa) for spatial object with hierarchical structure. The `sf` package provides - efficient access to data (writing and reading) - easy and fancy plotting - `sf` objects can be used as `data.frame` --- template: sf ## What is feature ? *A feature is thought of as a thing, or an object in the real world, such as a building or a tree. As is the case with objects, they often consist of other objects. This is the case with features too: a set of features can form a single feature. A forest stand can be a feature, a forest can be a feature, a city can be a feature. A satellite image pixel can be a feature, a complete image can be a feature too.* [Peb18]. All geometries are composed by a set points. --- template: sf *A feature is thought of as a thing, or an object in the real world, such as a building or a tree. As is the case with objects, they often consist of other objects. This is the case with features too: a set of features can form a single feature. A forest stand can be a feature, a forest can be a feature, a city can be a feature. A satellite image pixel can be a feature, a complete image can be a feature too.* [Peb18]. --- template: sf ### Point A two dimensionnal point refer to Esating and northing or longitude and latitude (for extension to more than 2D see the [sf vignette](https://r-spatial.github.io/sf/articles/sf1.html)) ```r x <- st_point(c(1,2)) x ``` ``` ## POINT (1 2) ``` ```r class(x) ``` ``` ## [1] "XY" "POINT" "sfg" ``` ```r x %>% ggplot() + geom_sf() ``` <img src="maps_files/figure-html/plot_point-1.png" width="30%" /> --- template: sf count: false ### Multi Point ```r p <- rbind( c(3.2,4), c(3,4.6), c(3.8,4.4), c(3.5,3.8), c(3.4,3.6), c(3.9,4.5)) (mp <- st_multipoint(p)) ``` ``` ## MULTIPOINT ((3.2 4), (3 4.6), (3.8 4.4), (3.5 3.8), (3.4 3.6), (3.9 4.5)) ``` ```r mp ``` ``` ## MULTIPOINT ((3.2 4), (3 4.6), (3.8 4.4), (3.5 3.8), (3.4 3.6), (3.9 4.5)) ``` ```r class(mp) ``` ``` ## [1] "XY" "MULTIPOINT" "sfg" ``` ```r mp %>% ggplot() + geom_sf() ``` <img src="maps_files/figure-html/multipoint_plot-1.png" width="30%" /> --- template: sf count: false ### Line ```r line_sfg <- st_linestring(p) line_sfg ``` ``` ## LINESTRING (3.2 4, 3 4.6, 3.8 4.4, 3.5 3.8, 3.4 3.6, 3.9 4.5) ``` ```r class(line_sfg) ``` ``` ## [1] "XY" "LINESTRING" "sfg" ``` ```r line_sfg%>% ggplot() + geom_sf() ``` <img src="maps_files/figure-html/line_plot-1.png" width="30%" /> --- template: sf count: false ### Polygon ```r p1 <- rbind(c(0,0), c(1,0), c(3,2), c(2,4), c(1,4), c(0,0)) p2 <- rbind(c(1,1), c(1,2), c(2,2), c(1,1)) poly_sfg <- st_polygon(list(p1, p2)) poly_sfg ``` ``` ## POLYGON ((0 0, 1 0, 3 2, 2 4, 1 4, 0 0), (1 1, 1 2, 2 2, 1 1)) ``` ```r class(poly_sfg ) ``` ``` ## [1] "XY" "POLYGON" "sfg" ``` ```r poly_sfg %>% ggplot() + geom_sf() ``` <img src="maps_files/figure-html/poly_plot-1.png" width="30%" /> --- template: sf count: false ### Point, Line Polygon ### MultiPoint, MultiLine MultiPolygon ### Geometry collection --- template: sf ## Reading vector spatial data The shapefile of the cities in Ile de France is available [here](https://www.data.gouv.fr/en/datasets/r/aad5c727-290e-4bc3-bc7e-d1e6b020f5c1) ```r idf_shape <- st_read(dsn = '../ile_de_france_shape/',) ``` ``` ## Reading layer `donnees-communales-sur-la-population-dile-de-france' from data source `/__w/Vizualisation/Vizualisation/ile_de_france_shape' using driver `ESRI Shapefile' ## Simple feature collection with 1287 features and 24 fields ## geometry type: POINT ## dimension: XY ## bbox: xmin: 1.480775 ymin: 48.1406 xmax: 3.489334 ymax: 49.21325 ## geographic CRS: WGS 84 ``` ```r idf_shape %>% print(n=10) ``` ``` ## Simple feature collection with 1287 features and 24 fields ## geometry type: POINT ## dimension: XY ## bbox: xmin: 1.480775 ymin: 48.1406 xmax: 3.489334 ymax: 49.21325 ## geographic CRS: WGS 84 ## First 10 features: ## insee pop1946 psdc1962 psdc1968 psdc1975 psdc1982 psdc1990 popexh1999 ## 1 93070 45465 51956 48886 43588 43606 42343 39719 ## 2 91573 571 602 611 1360 1849 3342 5797 ## 3 77434 123 105 69 98 172 214 289 ## 4 94070 688 701 774 2242 2621 2810 3138 ## 5 78586 17494 31267 40277 42253 46197 50329 50222 ## 6 77450 405 822 1174 1163 1526 1924 2791 ## 7 95607 5899 8606 12902 16963 21299 25151 25906 ## 8 77463 1378 1949 1906 2249 2647 3025 3200 ## 9 95610 163 180 173 188 201 229 229 ## 10 92076 3283 6690 8065 9257 8313 8118 8130 ## psdc82df99 psdc90df99 popmun2006 popmun2007 popmun2008 popmun2009 popmun2010 ## 1 43606 42343 42950 43954.30 45595 46510 47189 ## 2 1849 3342 7733 7818.00 7844 8083 8350 ## 3 172 214 312 316.00 320 322 330 ## 4 2621 2810 3550 3610.00 3675 3676 3724 ## 5 46197 50329 51600 51601.15 51447 51459 51150 ## 6 1526 1924 2851 2880.68 2910 2940 2974 ## 7 21299 25151 26436 26228.12 26349 26134 26144 ## 8 2647 3025 3290 3345.36 3385 3425 3436 ## 9 201 229 259 263.00 266 259 264 ## 10 8313 8118 8547 8670.01 8636 8618 8615 ## popmun2011 objectid popmun2012 popmun2013 popmun2014 popmun2015 tcam1217 ## 1 47783 1037 47499 47534 47432 48431 1.47542617 ## 2 8618 1042 9370 9758 10151 10501 2.94798840 ## 3 339 1048 347 350 348 352 0.68226909 ## 4 3688 1070 3651 3640 3644 3640 0.67022160 ## 5 51431 1073 51713 51599 51747 52538 0.09804205 ## 6 3104 1088 3121 3138 3154 3133 0.81952342 ## 7 26195 1113 26094 25998 25875 26077 0.26455800 ## 8 3429 1120 3443 3468 3493 3502 0.13902620 ## 9 268 1123 273 278 278 284 1.69948658 ## 10 8612 1156 8611 8816 8747 8688 0.12972916 ## popmun2016 popmun2017 geometry ## 1 49664 51108 POINT (2.333478 48.90959) ## 2 10851 10835 POINT (2.517426 48.60545) ## 3 355 359 POINT (3.205181 48.43767) ## 4 3708 3775 POINT (2.576295 48.73522) ## 5 52648 51967 POINT (2.174487 48.93982) ## 6 3233 3251 POINT (2.591731 48.71473) ## 7 26296 26441 POINT (2.220662 49.02636) ## 8 3493 3467 POINT (2.781282 48.40434) ## 9 291 297 POINT (1.905006 49.09092) ## 10 8628 8667 POINT (2.160643 48.84209) ``` --- template: sf ## Metropolitan French departments The limit of the French department are descibed in [this archive](http://www.infosig.net/telechargements/IGN_GEOFLA/GEOFLA-Dept-FR-Corse-TAB-L93.zip). ```r dpt_shape <- st_read(dsn = '../depts/', layer = 'DEPARTEMENT') ``` ``` ## Reading layer `DEPARTEMENT' from data source `/__w/Vizualisation/Vizualisation/depts' using driver `MapInfo File' ## Simple feature collection with 96 features and 11 fields ## geometry type: MULTIPOLYGON ## dimension: XY ## bbox: xmin: 99226 ymin: 6049647 xmax: 1242375 ymax: 7110524 ## projected CRS: RGF93 / Lambert-93 ``` ```r dpt_shape %>% print(n=10) ``` ``` ## Simple feature collection with 96 features and 11 fields ## geometry type: MULTIPOLYGON ## dimension: XY ## bbox: xmin: 99226 ymin: 6049647 xmax: 1242375 ymax: 7110524 ## projected CRS: RGF93 / Lambert-93 ## First 10 features: ## ID_GEOFLA CODE_DEPT NOM_DEPT CODE_CHF NOM_CHF ## 1 1 01 AIN 053 BOURG-EN-BRESSE ## 2 2 02 AISNE 408 LAON ## 3 3 03 ALLIER 190 MOULINS ## 4 4 04 ALPES-DE-HAUTE-PROVENCE 070 DIGNE-LES-BAINS ## 5 5 05 HAUTES-ALPES 061 GAP ## 6 6 06 ALPES-MARITIMES 088 NICE ## 7 7 07 ARDECHE 186 PRIVAS ## 8 8 08 ARDENNES 105 CHARLEVILLE-MEZIERES ## 9 9 09 ARIEGE 122 FOIX ## 10 10 10 AUBE 387 TROYES ## X_CHF_LIEU Y_CHF_LIEU X_CENTROID Y_CENTROID CODE_REG ## 1 8717 65696 8814 65582 82 ## 2 7451 69406 7404 69401 22 ## 3 7254 66072 7144 65882 83 ## 4 9590 63379 9596 63394 93 ## 5 9443 63891 9585 64014 93 ## 6 10439 62985 10303 63240 93 ## 7 8266 64052 8127 64068 82 ## 8 8239 69649 8186 69475 21 ## 9 5862 62083 5777 62035 73 ## 10 7799 68003 7861 68010 21 ## NOM_REGION geometry ## 1 RHONE-ALPES MULTIPOLYGON (((919195 6541... ## 2 PICARDIE MULTIPOLYGON (((735603 6861... ## 3 AUVERGNE MULTIPOLYGON (((753769 6537... ## 4 PROVENCE-ALPES-COTE-D'AZUR MULTIPOLYGON (((992638 6305... ## 5 PROVENCE-ALPES-COTE-D'AZUR MULTIPOLYGON (((1012913 640... ## 6 PROVENCE-ALPES-COTE-D'AZUR MULTIPOLYGON (((1018256 627... ## 7 RHONE-ALPES MULTIPOLYGON (((831641 6353... ## 8 CHAMPAGNE-ARDENNE MULTIPOLYGON (((842092 6905... ## 9 MIDI-PYRENEES MULTIPOLYGON (((631545 6174... ## 10 CHAMPAGNE-ARDENNE MULTIPOLYGON (((796594 6759... ``` --- template: sf count: false ## Metropolitan French departments ```r dpt_shape %>% ggplot() + geom_sf() ``` 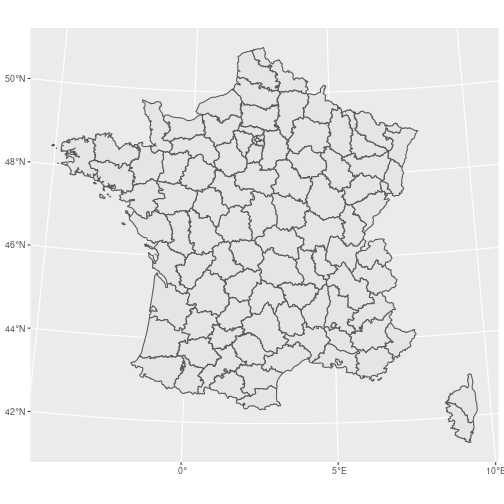<!-- --> --- template: sf count: false ## Metropolitan French departments The population by department is available [here](https://www.insee.fr/fr/statistiques/fichier/2012713/TCRD_004.xls) or [here in csv format]() ```r population <- read_csv("../population.csv", skip = 3) %>% rename(p2020 = '2020 (p)', p2017 = '2017', p2012 = '2012', p2007 = '2007', p1999 = '1999') ``` ``` ## ## ── Column specification ──────────────────────────────────────────────────────── ## cols( ## CODE_DEPT = col_character(), ## NAME_DEPT = col_character(), ## `2020 (p)` = col_double(), ## `Part dans la France (p) (en %)` = col_double(), ## `2017` = col_double(), ## `2012` = col_double(), ## `2007` = col_double(), ## `1999` = col_double() ## ) ``` Joining the two dataset ```r dpt_complete <- dpt_shape %>% inner_join( y = population, by = "CODE_DEPT") ``` --- template: sf count: false ## Metropolitan French departments ```r dpt_complete %>% ggplot2::ggplot() + geom_sf( aes(fill = p2017) ) ``` 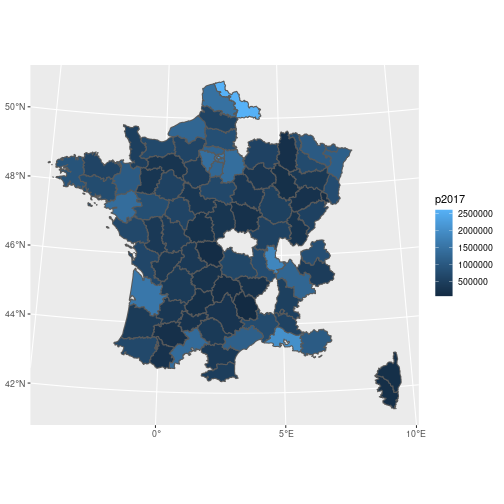<!-- --> --- count: false .panel1-plot_data_dpt1-auto[ ```r *dpt_complete %>% ggplot2::ggplot() ``` ] .panel2-plot_data_dpt1-auto[ <!-- --> ] --- count: false .panel1-plot_data_dpt1-auto[ ```r dpt_complete %>% ggplot2::ggplot() + * geom_sf( aes(fill = p2017) ) ``` ] .panel2-plot_data_dpt1-auto[ <!-- --> ] <style> .panel1-plot_data_dpt1-auto { color: black; width: 38.6060606060606%; hight: 32%; float: left; padding-left: 1%; font-size: 80% } .panel2-plot_data_dpt1-auto { color: black; width: 59.3939393939394%; hight: 32%; float: left; padding-left: 1%; font-size: 80% } .panel3-plot_data_dpt1-auto { color: black; width: NA%; hight: 33%; float: left; padding-left: 1%; font-size: 80% } </style> ```r dpt_complete %>% mutate(area = st_area(geometry), dens = p2017/area) %>% ggplot() + geom_sf(aes(fill = as.numeric(dens))) + scale_fill_gradient(low = "#75c9c5", high = "#fb1c05", trans = "log") + labs(fill = 'Density') ``` <!-- --> --- count: false .panel1-plot_data_dpt2-auto[ ```r *dpt_complete ``` ] .panel2-plot_data_dpt2-auto[ ``` ## Simple feature collection with 87 features and 18 fields ## geometry type: MULTIPOLYGON ## dimension: XY ## bbox: xmin: 99226 ymin: 6049647 xmax: 1242375 ymax: 7110524 ## projected CRS: RGF93 / Lambert-93 ## First 10 features: ## ID_GEOFLA CODE_DEPT NOM_DEPT CODE_CHF NOM_CHF X_CHF_LIEU ## 1 10 10 AUBE 387 TROYES 7799 ## 2 11 11 AUDE 069 CARCASSONNE 6472 ## 3 12 12 AVEYRON 202 RODEZ 6660 ## 4 13 13 BOUCHES-DU-RHONE 055 MARSEILLE 8929 ## 5 14 14 CALVADOS 118 CAEN 4543 ## 6 15 15 CANTAL 014 AURILLAC 6557 ## 7 16 16 CHARENTE 015 ANGOULEME 4788 ## 8 17 17 CHARENTE-MARITIME 300 LA ROCHELLE 3797 ## 9 18 18 CHER 033 BOURGES 6541 ## 10 19 19 CORREZE 272 TULLE 6037 ## Y_CHF_LIEU X_CENTROID Y_CENTROID CODE_REG NOM_REGION ## 1 68003 7861 68010 21 CHAMPAGNE-ARDENNE ## 2 62353 6522 62228 91 LANGUEDOC-ROUSSILLON ## 3 63613 6744 63535 73 MIDI-PYRENEES ## 4 62470 8686 62740 93 PROVENCE-ALPES-COTE-D'AZUR ## 5 69032 4544 68940 25 BASSE-NORMANDIE ## 6 64252 6739 64391 83 AUVERGNE ## 7 65095 4823 65170 54 POITOU-CHARENTES ## 8 65705 4165 65256 54 POITOU-CHARENTES ## 9 66649 6613 66628 24 CENTRE ## 10 64636 6120 64736 74 LIMOUSIN ## NAME_DEPT p2020 Part dans la France (p) (en %) p2017 p2012 ## 1 Aube 309907 0.5 310020 305606 ## 2 Aude 372705 0.6 370260 362339 ## 3 Aveyron 278360 0.4 279206 276229 ## 4 Bouches-du-Rhône 2034469 3.0 2024162 1984784 ## 5 Calvados 691453 1.0 694002 687854 ## 6 Cantal 142811 0.2 145143 147415 ## 7 Charente 348180 0.5 352335 353657 ## 8 Charente-Maritime 647080 1.0 644303 628733 ## 9 Cher 296404 0.4 304256 311897 ## 10 Corrèze 240336 0.4 241464 241247 ## p2007 p1999 geometry ## 1 300840 292317 MULTIPOLYGON (((796594 6759... ## 2 345779 309463 MULTIPOLYGON (((703561 6193... ## 3 274425 264048 MULTIPOLYGON (((728810 6312... ## 4 1958926 1833982 MULTIPOLYGON (((917346 6234... ## 5 673667 647951 MULTIPOLYGON (((510545 6875... ## 6 149057 150977 MULTIPOLYGON (((637122 6391... ## 7 349535 339828 MULTIPOLYGON (((464807 6459... ## 8 605410 556419 MULTIPOLYGON (((460931 6449... ## 9 314599 314603 MULTIPOLYGON (((644784 6591... ## 10 242038 232819 MULTIPOLYGON (((626129 6431... ``` ] --- count: false .panel1-plot_data_dpt2-auto[ ```r dpt_complete %>% * mutate(area = st_area(geometry), dens = p2017/area) ``` ] .panel2-plot_data_dpt2-auto[ ``` ## Simple feature collection with 87 features and 20 fields ## geometry type: MULTIPOLYGON ## dimension: XY ## bbox: xmin: 99226 ymin: 6049647 xmax: 1242375 ymax: 7110524 ## projected CRS: RGF93 / Lambert-93 ## First 10 features: ## ID_GEOFLA CODE_DEPT NOM_DEPT CODE_CHF NOM_CHF X_CHF_LIEU ## 1 10 10 AUBE 387 TROYES 7799 ## 2 11 11 AUDE 069 CARCASSONNE 6472 ## 3 12 12 AVEYRON 202 RODEZ 6660 ## 4 13 13 BOUCHES-DU-RHONE 055 MARSEILLE 8929 ## 5 14 14 CALVADOS 118 CAEN 4543 ## 6 15 15 CANTAL 014 AURILLAC 6557 ## 7 16 16 CHARENTE 015 ANGOULEME 4788 ## 8 17 17 CHARENTE-MARITIME 300 LA ROCHELLE 3797 ## 9 18 18 CHER 033 BOURGES 6541 ## 10 19 19 CORREZE 272 TULLE 6037 ## Y_CHF_LIEU X_CENTROID Y_CENTROID CODE_REG NOM_REGION ## 1 68003 7861 68010 21 CHAMPAGNE-ARDENNE ## 2 62353 6522 62228 91 LANGUEDOC-ROUSSILLON ## 3 63613 6744 63535 73 MIDI-PYRENEES ## 4 62470 8686 62740 93 PROVENCE-ALPES-COTE-D'AZUR ## 5 69032 4544 68940 25 BASSE-NORMANDIE ## 6 64252 6739 64391 83 AUVERGNE ## 7 65095 4823 65170 54 POITOU-CHARENTES ## 8 65705 4165 65256 54 POITOU-CHARENTES ## 9 66649 6613 66628 24 CENTRE ## 10 64636 6120 64736 74 LIMOUSIN ## NAME_DEPT p2020 Part dans la France (p) (en %) p2017 p2012 ## 1 Aube 309907 0.5 310020 305606 ## 2 Aude 372705 0.6 370260 362339 ## 3 Aveyron 278360 0.4 279206 276229 ## 4 Bouches-du-Rhône 2034469 3.0 2024162 1984784 ## 5 Calvados 691453 1.0 694002 687854 ## 6 Cantal 142811 0.2 145143 147415 ## 7 Charente 348180 0.5 352335 353657 ## 8 Charente-Maritime 647080 1.0 644303 628733 ## 9 Cher 296404 0.4 304256 311897 ## 10 Corrèze 240336 0.4 241464 241247 ## p2007 p1999 geometry area ## 1 300840 292317 MULTIPOLYGON (((796594 6759... 6020293118 [m^2] ## 2 345779 309463 MULTIPOLYGON (((703561 6193... 6356214401 [m^2] ## 3 274425 264048 MULTIPOLYGON (((728810 6312... 8770954522 [m^2] ## 4 1958926 1833982 MULTIPOLYGON (((917346 6234... 5093290260 [m^2] ## 5 673667 647951 MULTIPOLYGON (((510545 6875... 5605649712 [m^2] ## 6 149057 150977 MULTIPOLYGON (((637122 6391... 5768091192 [m^2] ## 7 349535 339828 MULTIPOLYGON (((464807 6459... 5963483218 [m^2] ## 8 605410 556419 MULTIPOLYGON (((460931 6449... 6901566358 [m^2] ## 9 314599 314603 MULTIPOLYGON (((644784 6591... 7295949293 [m^2] ## 10 242038 232819 MULTIPOLYGON (((626129 6431... 5891105885 [m^2] ## dens ## 1 5.149583e-05 [1/m^2] ## 2 5.825165e-05 [1/m^2] ## 3 3.183302e-05 [1/m^2] ## 4 3.974174e-04 [1/m^2] ## 5 1.238040e-04 [1/m^2] ## 6 2.516309e-05 [1/m^2] ## 7 5.908208e-05 [1/m^2] ## 8 9.335605e-05 [1/m^2] ## 9 4.170204e-05 [1/m^2] ## 10 4.098789e-05 [1/m^2] ``` ] --- count: false .panel1-plot_data_dpt2-auto[ ```r dpt_complete %>% mutate(area = st_area(geometry), dens = p2017/area) %>% * ggplot() ``` ] .panel2-plot_data_dpt2-auto[ <!-- --> ] --- count: false .panel1-plot_data_dpt2-auto[ ```r dpt_complete %>% mutate(area = st_area(geometry), dens = p2017/area) %>% ggplot() + * geom_sf(aes(fill = as.numeric(dens))) ``` ] .panel2-plot_data_dpt2-auto[ <!-- --> ] --- count: false .panel1-plot_data_dpt2-auto[ ```r dpt_complete %>% mutate(area = st_area(geometry), dens = p2017/area) %>% ggplot() + geom_sf(aes(fill = as.numeric(dens))) + * scale_fill_gradient(low = "#75c9c5", high = "#fb1c05", trans = "log") ``` ] .panel2-plot_data_dpt2-auto[ <!-- --> ] --- count: false .panel1-plot_data_dpt2-auto[ ```r dpt_complete %>% mutate(area = st_area(geometry), dens = p2017/area) %>% ggplot() + geom_sf(aes(fill = as.numeric(dens))) + scale_fill_gradient(low = "#75c9c5", high = "#fb1c05", trans = "log") + * labs(fill = 'Density') ``` ] .panel2-plot_data_dpt2-auto[ 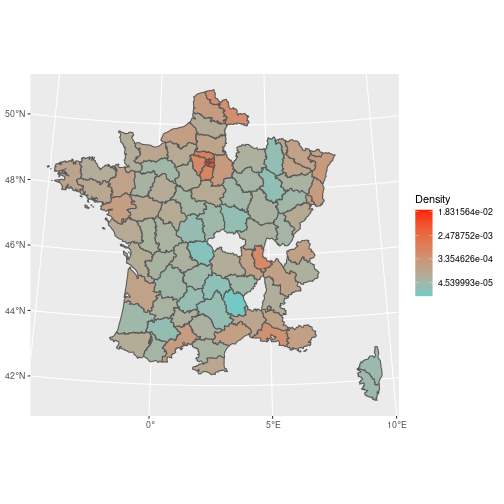<!-- --> ] <style> .panel1-plot_data_dpt2-auto { color: black; width: 38.6060606060606%; hight: 32%; float: left; padding-left: 1%; font-size: 80% } .panel2-plot_data_dpt2-auto { color: black; width: 59.3939393939394%; hight: 32%; float: left; padding-left: 1%; font-size: 80% } .panel3-plot_data_dpt2-auto { color: black; width: NA%; hight: 33%; float: left; padding-left: 1%; font-size: 80% } </style> --- template: sf count: false ## From departments to regions ### Tidying the dataset ```r dpt_complete %>% print(n=5) ``` ``` ## Simple feature collection with 87 features and 18 fields ## geometry type: MULTIPOLYGON ## dimension: XY ## bbox: xmin: 99226 ymin: 6049647 xmax: 1242375 ymax: 7110524 ## projected CRS: RGF93 / Lambert-93 ## First 5 features: ## ID_GEOFLA CODE_DEPT NOM_DEPT CODE_CHF NOM_CHF X_CHF_LIEU ## 1 10 10 AUBE 387 TROYES 7799 ## 2 11 11 AUDE 069 CARCASSONNE 6472 ## 3 12 12 AVEYRON 202 RODEZ 6660 ## 4 13 13 BOUCHES-DU-RHONE 055 MARSEILLE 8929 ## 5 14 14 CALVADOS 118 CAEN 4543 ## Y_CHF_LIEU X_CENTROID Y_CENTROID CODE_REG NOM_REGION ## 1 68003 7861 68010 21 CHAMPAGNE-ARDENNE ## 2 62353 6522 62228 91 LANGUEDOC-ROUSSILLON ## 3 63613 6744 63535 73 MIDI-PYRENEES ## 4 62470 8686 62740 93 PROVENCE-ALPES-COTE-D'AZUR ## 5 69032 4544 68940 25 BASSE-NORMANDIE ## NAME_DEPT p2020 Part dans la France (p) (en %) p2017 p2012 ## 1 Aube 309907 0.5 310020 305606 ## 2 Aude 372705 0.6 370260 362339 ## 3 Aveyron 278360 0.4 279206 276229 ## 4 Bouches-du-Rhône 2034469 3.0 2024162 1984784 ## 5 Calvados 691453 1.0 694002 687854 ## p2007 p1999 geometry ## 1 300840 292317 MULTIPOLYGON (((796594 6759... ## 2 345779 309463 MULTIPOLYGON (((703561 6193... ## 3 274425 264048 MULTIPOLYGON (((728810 6312... ## 4 1958926 1833982 MULTIPOLYGON (((917346 6234... ## 5 673667 647951 MULTIPOLYGON (((510545 6875... ``` ```r dpt_complete %>% select(ID_GEOFLA, CODE_DEPT, NOM_DEPT, NOM_REGION, p2020, p2017, p2012, p2007, p1999) %>% pivot_longer(cols = starts_with("p"), names_to = 'Year', values_to = 'Population' ) %>% group_by(NOM_REGION, Year) %>% summarise(pop = sum(Population), geometry= st_union(geometry) , area = units::set_units(st_area(geometry), km^2), dens = (pop/area)) %>% st_as_sf() -> region_complete ``` ``` ## Warning in val_cols[col_id] <- unname(as.list(data[cols])): number of items to ## replace is not a multiple of replacement length ``` ``` ## `summarise()` has grouped output by 'NOM_REGION'. You can override using the ## `.groups` argument. ``` ```r region_complete %>% ggplot() + facet_wrap(~Year) + geom_sf(aes(fill = as.numeric(dens), geometry = geometry)) + scale_fill_gradient(low = "#75c9c5", high = "#fb1c05", trans = "log", breaks = c(50, 150, 450), name = 'Density') ``` 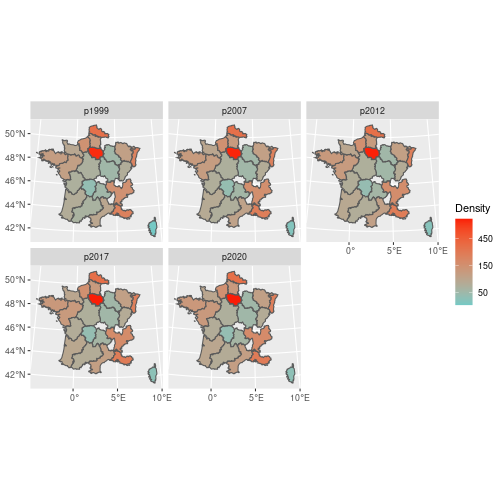<!-- --> --- count: false .panel1-tidying_eval2-auto[ ```r *dpt_complete ``` ] .panel2-tidying_eval2-auto[ ``` ## Simple feature collection with 87 features and 18 fields ## geometry type: MULTIPOLYGON ## dimension: XY ## bbox: xmin: 99226 ymin: 6049647 xmax: 1242375 ymax: 7110524 ## projected CRS: RGF93 / Lambert-93 ## First 10 features: ## ID_GEOFLA CODE_DEPT NOM_DEPT CODE_CHF NOM_CHF X_CHF_LIEU ## 1 10 10 AUBE 387 TROYES 7799 ## 2 11 11 AUDE 069 CARCASSONNE 6472 ## 3 12 12 AVEYRON 202 RODEZ 6660 ## 4 13 13 BOUCHES-DU-RHONE 055 MARSEILLE 8929 ## 5 14 14 CALVADOS 118 CAEN 4543 ## 6 15 15 CANTAL 014 AURILLAC 6557 ## 7 16 16 CHARENTE 015 ANGOULEME 4788 ## 8 17 17 CHARENTE-MARITIME 300 LA ROCHELLE 3797 ## 9 18 18 CHER 033 BOURGES 6541 ## 10 19 19 CORREZE 272 TULLE 6037 ## Y_CHF_LIEU X_CENTROID Y_CENTROID CODE_REG NOM_REGION ## 1 68003 7861 68010 21 CHAMPAGNE-ARDENNE ## 2 62353 6522 62228 91 LANGUEDOC-ROUSSILLON ## 3 63613 6744 63535 73 MIDI-PYRENEES ## 4 62470 8686 62740 93 PROVENCE-ALPES-COTE-D'AZUR ## 5 69032 4544 68940 25 BASSE-NORMANDIE ## 6 64252 6739 64391 83 AUVERGNE ## 7 65095 4823 65170 54 POITOU-CHARENTES ## 8 65705 4165 65256 54 POITOU-CHARENTES ## 9 66649 6613 66628 24 CENTRE ## 10 64636 6120 64736 74 LIMOUSIN ## NAME_DEPT p2020 Part dans la France (p) (en %) p2017 p2012 ## 1 Aube 309907 0.5 310020 305606 ## 2 Aude 372705 0.6 370260 362339 ## 3 Aveyron 278360 0.4 279206 276229 ## 4 Bouches-du-Rhône 2034469 3.0 2024162 1984784 ## 5 Calvados 691453 1.0 694002 687854 ## 6 Cantal 142811 0.2 145143 147415 ## 7 Charente 348180 0.5 352335 353657 ## 8 Charente-Maritime 647080 1.0 644303 628733 ## 9 Cher 296404 0.4 304256 311897 ## 10 Corrèze 240336 0.4 241464 241247 ## p2007 p1999 geometry ## 1 300840 292317 MULTIPOLYGON (((796594 6759... ## 2 345779 309463 MULTIPOLYGON (((703561 6193... ## 3 274425 264048 MULTIPOLYGON (((728810 6312... ## 4 1958926 1833982 MULTIPOLYGON (((917346 6234... ## 5 673667 647951 MULTIPOLYGON (((510545 6875... ## 6 149057 150977 MULTIPOLYGON (((637122 6391... ## 7 349535 339828 MULTIPOLYGON (((464807 6459... ## 8 605410 556419 MULTIPOLYGON (((460931 6449... ## 9 314599 314603 MULTIPOLYGON (((644784 6591... ## 10 242038 232819 MULTIPOLYGON (((626129 6431... ``` ] --- count: false .panel1-tidying_eval2-auto[ ```r dpt_complete %>% * select(ID_GEOFLA, CODE_DEPT, NOM_DEPT, NOM_REGION, * p2020, p2017, p2012, p2007, p1999) ``` ] .panel2-tidying_eval2-auto[ ``` ## Simple feature collection with 87 features and 9 fields ## geometry type: MULTIPOLYGON ## dimension: XY ## bbox: xmin: 99226 ymin: 6049647 xmax: 1242375 ymax: 7110524 ## projected CRS: RGF93 / Lambert-93 ## First 10 features: ## ID_GEOFLA CODE_DEPT NOM_DEPT NOM_REGION p2020 ## 1 10 10 AUBE CHAMPAGNE-ARDENNE 309907 ## 2 11 11 AUDE LANGUEDOC-ROUSSILLON 372705 ## 3 12 12 AVEYRON MIDI-PYRENEES 278360 ## 4 13 13 BOUCHES-DU-RHONE PROVENCE-ALPES-COTE-D'AZUR 2034469 ## 5 14 14 CALVADOS BASSE-NORMANDIE 691453 ## 6 15 15 CANTAL AUVERGNE 142811 ## 7 16 16 CHARENTE POITOU-CHARENTES 348180 ## 8 17 17 CHARENTE-MARITIME POITOU-CHARENTES 647080 ## 9 18 18 CHER CENTRE 296404 ## 10 19 19 CORREZE LIMOUSIN 240336 ## p2017 p2012 p2007 p1999 geometry ## 1 310020 305606 300840 292317 MULTIPOLYGON (((796594 6759... ## 2 370260 362339 345779 309463 MULTIPOLYGON (((703561 6193... ## 3 279206 276229 274425 264048 MULTIPOLYGON (((728810 6312... ## 4 2024162 1984784 1958926 1833982 MULTIPOLYGON (((917346 6234... ## 5 694002 687854 673667 647951 MULTIPOLYGON (((510545 6875... ## 6 145143 147415 149057 150977 MULTIPOLYGON (((637122 6391... ## 7 352335 353657 349535 339828 MULTIPOLYGON (((464807 6459... ## 8 644303 628733 605410 556419 MULTIPOLYGON (((460931 6449... ## 9 304256 311897 314599 314603 MULTIPOLYGON (((644784 6591... ## 10 241464 241247 242038 232819 MULTIPOLYGON (((626129 6431... ``` ] --- count: false .panel1-tidying_eval2-auto[ ```r dpt_complete %>% select(ID_GEOFLA, CODE_DEPT, NOM_DEPT, NOM_REGION, p2020, p2017, p2012, p2007, p1999) %>% * pivot_longer(cols = starts_with("p"), names_to = 'Year', values_to = 'Population' ) ``` ] .panel2-tidying_eval2-auto[ ``` ## Warning in val_cols[col_id] <- unname(as.list(data[cols])): number of items to ## replace is not a multiple of replacement length ``` ``` ## # A tibble: 435 × 7 ## ID_GEOFLA CODE_DEPT NOM_DEPT NOM_RE…¹ geometry Year Popul…² ## <dbl> <chr> <chr> <chr> <MULTIPOLYGON [m]> <chr> <dbl> ## 1 10 10 AUBE CHAMPAG… (((796594 6759156, 79623… p2020 309907 ## 2 10 10 AUBE CHAMPAG… (((796594 6759156, 79623… p2017 310020 ## 3 10 10 AUBE CHAMPAG… (((796594 6759156, 79623… p2012 305606 ## 4 10 10 AUBE CHAMPAG… (((796594 6759156, 79623… p2007 300840 ## 5 10 10 AUBE CHAMPAG… (((796594 6759156, 79623… p1999 292317 ## 6 11 11 AUDE LANGUED… (((703561 6193187, 70323… p2020 372705 ## 7 11 11 AUDE LANGUED… (((703561 6193187, 70323… p2017 370260 ## 8 11 11 AUDE LANGUED… (((703561 6193187, 70323… p2012 362339 ## 9 11 11 AUDE LANGUED… (((703561 6193187, 70323… p2007 345779 ## 10 11 11 AUDE LANGUED… (((703561 6193187, 70323… p1999 309463 ## # … with 425 more rows, and abbreviated variable names ¹NOM_REGION, ²Population ``` ] --- count: false .panel1-tidying_eval2-auto[ ```r dpt_complete %>% select(ID_GEOFLA, CODE_DEPT, NOM_DEPT, NOM_REGION, p2020, p2017, p2012, p2007, p1999) %>% pivot_longer(cols = starts_with("p"), names_to = 'Year', values_to = 'Population' ) %>% * group_by(NOM_REGION, Year) ``` ] .panel2-tidying_eval2-auto[ ``` ## Warning in val_cols[col_id] <- unname(as.list(data[cols])): number of items to ## replace is not a multiple of replacement length ``` ``` ## # A tibble: 435 × 7 ## # Groups: NOM_REGION, Year [110] ## ID_GEOFLA CODE_DEPT NOM_DEPT NOM_RE…¹ geometry Year Popul…² ## <dbl> <chr> <chr> <chr> <MULTIPOLYGON [m]> <chr> <dbl> ## 1 10 10 AUBE CHAMPAG… (((796594 6759156, 79623… p2020 309907 ## 2 10 10 AUBE CHAMPAG… (((796594 6759156, 79623… p2017 310020 ## 3 10 10 AUBE CHAMPAG… (((796594 6759156, 79623… p2012 305606 ## 4 10 10 AUBE CHAMPAG… (((796594 6759156, 79623… p2007 300840 ## 5 10 10 AUBE CHAMPAG… (((796594 6759156, 79623… p1999 292317 ## 6 11 11 AUDE LANGUED… (((703561 6193187, 70323… p2020 372705 ## 7 11 11 AUDE LANGUED… (((703561 6193187, 70323… p2017 370260 ## 8 11 11 AUDE LANGUED… (((703561 6193187, 70323… p2012 362339 ## 9 11 11 AUDE LANGUED… (((703561 6193187, 70323… p2007 345779 ## 10 11 11 AUDE LANGUED… (((703561 6193187, 70323… p1999 309463 ## # … with 425 more rows, and abbreviated variable names ¹NOM_REGION, ²Population ``` ] --- count: false .panel1-tidying_eval2-auto[ ```r dpt_complete %>% select(ID_GEOFLA, CODE_DEPT, NOM_DEPT, NOM_REGION, p2020, p2017, p2012, p2007, p1999) %>% pivot_longer(cols = starts_with("p"), names_to = 'Year', values_to = 'Population' ) %>% group_by(NOM_REGION, Year) %>% * summarise(pop = sum(Population), geometry= st_union(geometry) , * area = units::set_units(st_area(geometry), km^2), dens = (pop/area)) %>% st_as_sf() ``` ] .panel2-tidying_eval2-auto[ ``` ## Warning in val_cols[col_id] <- unname(as.list(data[cols])): number of items to ## replace is not a multiple of replacement length ``` ``` ## Simple feature collection with 110 features and 5 fields ## geometry type: GEOMETRY ## dimension: XY ## bbox: xmin: 99226 ymin: 6049647 xmax: 1242375 ymax: 7110524 ## projected CRS: RGF93 / Lambert-93 ## # A tibble: 110 × 6 ## # Groups: NOM_REGION [22] ## NOM_REGION Year pop geometry area dens ## <chr> <chr> <dbl> <GEOMETRY [m]> [km^2] [1/km^2] ## 1 ALSACE p1999 1732588 POLYGON ((1040442 6789985, 104040… 8319.64 208.252… ## 2 ALSACE p2007 1827248 POLYGON ((1040442 6789985, 104040… 8319.64 219.630… ## 3 ALSACE p2012 1859869 POLYGON ((1040442 6789985, 104040… 8319.64 223.551… ## 4 ALSACE p2017 1889589 POLYGON ((1040442 6789985, 104040… 8319.64 227.123… ## 5 ALSACE p2020 1895811 POLYGON ((1040442 6789985, 104040… 8319.64 227.871… ## 6 AQUITAINE p1999 2906748 MULTIPOLYGON (((428954 6200122, 4… 41783.65 69.566… ## 7 AQUITAINE p2007 3150890 MULTIPOLYGON (((428954 6200122, 4… 41783.65 75.409… ## 8 AQUITAINE p2012 3285970 MULTIPOLYGON (((428954 6200122, 4… 41783.65 78.642… ## 9 AQUITAINE p2017 3414585 MULTIPOLYGON (((428954 6200122, 4… 41783.65 81.720… ## 10 AQUITAINE p2020 3467317 MULTIPOLYGON (((428954 6200122, 4… 41783.65 82.982… ## # … with 100 more rows ``` ] --- count: false .panel1-tidying_eval2-auto[ ```r dpt_complete %>% select(ID_GEOFLA, CODE_DEPT, NOM_DEPT, NOM_REGION, p2020, p2017, p2012, p2007, p1999) %>% pivot_longer(cols = starts_with("p"), names_to = 'Year', values_to = 'Population' ) %>% group_by(NOM_REGION, Year) %>% summarise(pop = sum(Population), geometry= st_union(geometry) , area = units::set_units(st_area(geometry), km^2), dens = (pop/area)) %>% st_as_sf() -> * region_complete ``` ] .panel2-tidying_eval2-auto[ ``` ## Warning in val_cols[col_id] <- unname(as.list(data[cols])): number of items to ## replace is not a multiple of replacement length ``` ] --- count: false .panel1-tidying_eval2-auto[ ```r dpt_complete %>% select(ID_GEOFLA, CODE_DEPT, NOM_DEPT, NOM_REGION, p2020, p2017, p2012, p2007, p1999) %>% pivot_longer(cols = starts_with("p"), names_to = 'Year', values_to = 'Population' ) %>% group_by(NOM_REGION, Year) %>% summarise(pop = sum(Population), geometry= st_union(geometry) , area = units::set_units(st_area(geometry), km^2), dens = (pop/area)) %>% st_as_sf() -> region_complete *region_complete ``` ] .panel2-tidying_eval2-auto[ ``` ## Warning in val_cols[col_id] <- unname(as.list(data[cols])): number of items to ## replace is not a multiple of replacement length ``` ``` ## Simple feature collection with 110 features and 5 fields ## geometry type: GEOMETRY ## dimension: XY ## bbox: xmin: 99226 ymin: 6049647 xmax: 1242375 ymax: 7110524 ## projected CRS: RGF93 / Lambert-93 ## # A tibble: 110 × 6 ## # Groups: NOM_REGION [22] ## NOM_REGION Year pop geometry area dens ## <chr> <chr> <dbl> <GEOMETRY [m]> [km^2] [1/km^2] ## 1 ALSACE p1999 1732588 POLYGON ((1040442 6789985, 104040… 8319.64 208.252… ## 2 ALSACE p2007 1827248 POLYGON ((1040442 6789985, 104040… 8319.64 219.630… ## 3 ALSACE p2012 1859869 POLYGON ((1040442 6789985, 104040… 8319.64 223.551… ## 4 ALSACE p2017 1889589 POLYGON ((1040442 6789985, 104040… 8319.64 227.123… ## 5 ALSACE p2020 1895811 POLYGON ((1040442 6789985, 104040… 8319.64 227.871… ## 6 AQUITAINE p1999 2906748 MULTIPOLYGON (((428954 6200122, 4… 41783.65 69.566… ## 7 AQUITAINE p2007 3150890 MULTIPOLYGON (((428954 6200122, 4… 41783.65 75.409… ## 8 AQUITAINE p2012 3285970 MULTIPOLYGON (((428954 6200122, 4… 41783.65 78.642… ## 9 AQUITAINE p2017 3414585 MULTIPOLYGON (((428954 6200122, 4… 41783.65 81.720… ## 10 AQUITAINE p2020 3467317 MULTIPOLYGON (((428954 6200122, 4… 41783.65 82.982… ## # … with 100 more rows ``` ] --- count: false .panel1-tidying_eval2-auto[ ```r dpt_complete %>% select(ID_GEOFLA, CODE_DEPT, NOM_DEPT, NOM_REGION, p2020, p2017, p2012, p2007, p1999) %>% pivot_longer(cols = starts_with("p"), names_to = 'Year', values_to = 'Population' ) %>% group_by(NOM_REGION, Year) %>% summarise(pop = sum(Population), geometry= st_union(geometry) , area = units::set_units(st_area(geometry), km^2), dens = (pop/area)) %>% st_as_sf() -> region_complete region_complete %>% * ggplot() + facet_wrap(~Year) + geom_sf(aes(fill = as.numeric(dens), geometry = geometry)) ``` ] .panel2-tidying_eval2-auto[ ``` ## Warning in val_cols[col_id] <- unname(as.list(data[cols])): number of items to ## replace is not a multiple of replacement length ``` 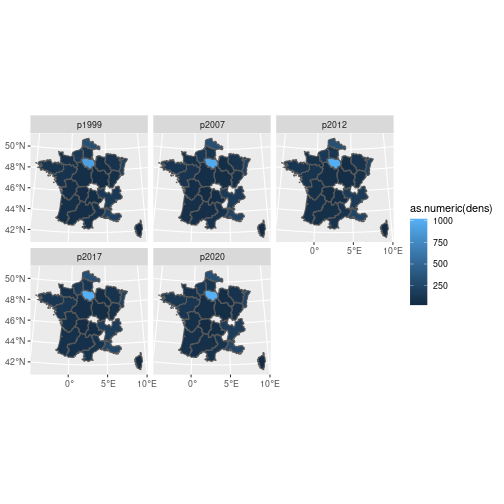<!-- --> ] --- count: false .panel1-tidying_eval2-auto[ ```r dpt_complete %>% select(ID_GEOFLA, CODE_DEPT, NOM_DEPT, NOM_REGION, p2020, p2017, p2012, p2007, p1999) %>% pivot_longer(cols = starts_with("p"), names_to = 'Year', values_to = 'Population' ) %>% group_by(NOM_REGION, Year) %>% summarise(pop = sum(Population), geometry= st_union(geometry) , area = units::set_units(st_area(geometry), km^2), dens = (pop/area)) %>% st_as_sf() -> region_complete region_complete %>% ggplot() + facet_wrap(~Year) + geom_sf(aes(fill = as.numeric(dens), geometry = geometry)) + * scale_fill_gradient(low = "#75c9c5", high = "#fb1c05", trans = "log", breaks = c(50, 150, 450), * name = 'Density') ``` ] .panel2-tidying_eval2-auto[ ``` ## Warning in val_cols[col_id] <- unname(as.list(data[cols])): number of items to ## replace is not a multiple of replacement length ``` 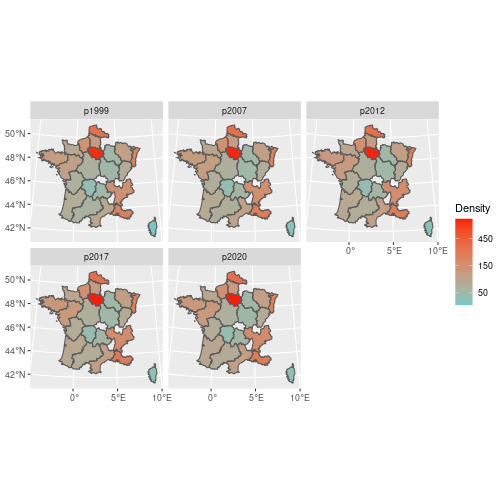<!-- --> ] <style> .panel1-tidying_eval2-auto { color: black; width: 38.6060606060606%; hight: 32%; float: left; padding-left: 1%; font-size: 80% } .panel2-tidying_eval2-auto { color: black; width: 59.3939393939394%; hight: 32%; float: left; padding-left: 1%; font-size: 80% } .panel3-tidying_eval2-auto { color: black; width: NA%; hight: 33%; float: left; padding-left: 1%; font-size: 80% } </style> --- name: leaflet # Leaflet to build interactive maps --- template: leaflet ## Presentation of the fisheries example ```r longline_dta <- read.table('https://raw.githubusercontent.com/MarieEtienne/MarieEtienne.github.io/master/datasets/LonglineExample.csv', sep = ";", header= TRUE, skip = 3) %>% as_tibble() %>% rename(Nyellow = Nyelloweye_caught, Area = DFO_STAT_AREA_CODE, Lat = Lat_start , Long = Lon_start, soaktime = soaktime_mn) %>% select(Year, Area, Lat, Long, soaktime, Nyellow) longline_dta %>% print(n=5) ``` ``` ## # A tibble: 210 × 6 ## Year Area Lat Long soaktime Nyellow ## <int> <int> <dbl> <dbl> <int> <int> ## 1 2003 12 50.8 -128. 127 6 ## 2 2003 12 50.9 -128. 128 0 ## 3 2003 12 50.9 -128. 127 3 ## 4 2003 12 50.9 -127. 122 0 ## 5 2003 12 50.9 -127. 134 2 ## # … with 205 more rows ``` --- template: leaflet ## Mapping the area of interest ```r library('leaflet') longline_map <- leaflet() %>% setView(lng = mean(longline_dta$Long), lat = mean(longline_dta$Lat), zoom = 4) %>% addTiles() longline_map ``` <div id="htmlwidget-db0bc91875cdfaf0d8ad" style="width:504px;height:504px;" class="leaflet html-widget"></div> <script type="application/json" data-for="htmlwidget-db0bc91875cdfaf0d8ad">{"x":{"options":{"crs":{"crsClass":"L.CRS.EPSG3857","code":null,"proj4def":null,"projectedBounds":null,"options":{}}},"setView":[[50.5450476190476,-126.216],4,[]],"calls":[{"method":"addTiles","args":["//{s}.tile.openstreetmap.org/{z}/{x}/{y}.png",null,null,{"minZoom":0,"maxZoom":18,"tileSize":256,"subdomains":"abc","errorTileUrl":"","tms":false,"noWrap":false,"zoomOffset":0,"zoomReverse":false,"opacity":1,"zIndex":1,"detectRetina":false,"attribution":"© <a href=\"http://openstreetmap.org\">OpenStreetMap<\/a> contributors, <a href=\"http://creativecommons.org/licenses/by-sa/2.0/\">CC-BY-SA<\/a>"}]}]},"evals":[],"jsHooks":[]}</script> --- template: leaflet ## Adding information ```r longline_map %>% addCircles(lng = longline_dta$Long, lat = longline_dta$Lat) ``` <div id="htmlwidget-3ad0cfe3f5dc4c29eb86" style="width:504px;height:504px;" class="leaflet html-widget"></div> <script type="application/json" data-for="htmlwidget-3ad0cfe3f5dc4c29eb86">{"x":{"options":{"crs":{"crsClass":"L.CRS.EPSG3857","code":null,"proj4def":null,"projectedBounds":null,"options":{}}},"setView":[[50.5450476190476,-126.216],4,[]],"calls":[{"method":"addTiles","args":["//{s}.tile.openstreetmap.org/{z}/{x}/{y}.png",null,null,{"minZoom":0,"maxZoom":18,"tileSize":256,"subdomains":"abc","errorTileUrl":"","tms":false,"noWrap":false,"zoomOffset":0,"zoomReverse":false,"opacity":1,"zIndex":1,"detectRetina":false,"attribution":"© <a href=\"http://openstreetmap.org\">OpenStreetMap<\/a> contributors, <a href=\"http://creativecommons.org/licenses/by-sa/2.0/\">CC-BY-SA<\/a>"}]},{"method":"addCircles","args":[[50.81,50.88,50.93,50.87,50.89,50.88,50.88,50.84,50.73,50.9,50.87,50.87,50.85,50.8,50.77,50.67,50.72,50.75,50.78,50.8,50.82,50.82,50.77,50.72,50.65,50.61,50.63,50.61,50.67,50.67,50.78,50.8,50.76,50.63,50.71,50.64,50.63,50.63,50.61,50.59,50.7,50.64,50.56,50.54,50.47,50.48,50.61,50.6,50.68,50.73,50.77,50.82,50.84,50.82,50.9,50.87,50.89,50.85,50.81,50.76,50.93,50.91,50.76,50.79,50.77,50.9,50.88,50.84,50.56,50.53,50.51,50.66,50.79,50.78,50.61,50.59,50.61,50.68,50.65,50.46,50.46,50.78,50.8,50.82,50.82,50.89,50.92,50.94,50.95,50.92,50.83,50.87,50.89,50.87,50.76,50.73,50.73,50.68,50.8,50.71,50.7,50.68,50.57,50.59,50.62,50.6,50.62,50.78,50.77,50.83,50.74,50.73,50.72,50.71,50.67,50.6,50.59,50.5,50.54,50.52,50.49,50.5,50.47,50.82,50.81,50.78,50.77,50.62,50.67,50.66,50.45,50.37,50.39,50.46,50.48,50.01,50.04,49.99,50.11,50.43,50.44,50.36,50.59,50.5,50.47,50.47,50.38,50.37,50.58,50.48,50.51,50.48,50.49,50.62,50.44,50.49,50.43,50.46,50.48,50.63,50.63,50.37,50.32,50.35,50.38,50.32,50.45,50.51,50.53,50.44,50.4,50.39,50.5,50.46,50.52,50.51,50.43,50.37,50.32,50.3,50.13,50.11,50.04,50.03,49.99,50.39,50.45,50.4,50.42,50.05,50.26,50.3,50.31,50.33,50.34,50.01,49.94,49.44,49.45,49.5,49.54,49.57,49.74,49.92,49.94,49.91,49.87,49.58,49.52,49.45],[-127.66,-127.64,-127.77,-127.46,-127.42,-127.39,-127.24,-127.09,-127.41,-127.01,-126.68,-126.65,-126.61,-126.81,-126.53,-126.69,-126.78,-126.64,-126.69,-126.57,-126.38,-126.36,-126.21,-126.18,-126.25,-126.33,-126.43,-126.73,-127.15,-126.97,-126.9,-126.88,-126.88,-127.19,-127.21,-127.2,-127.07,-127.05,-126.93,-126.76,-126.86,-126.85,-126.8,-126.77,-126.29,-126.01,-127.08,-126.91,-126.93,-126.98,-126.9,-126.96,-127.09,-127.01,-127,-127.29,-127.39,-127.45,-127.48,-127.41,-127.76,-127.7,-126.8,-126.86,-126.66,-126.78,-126.57,-126.6,-126.76,-126.62,-126.65,-126.39,-126.2,-126.22,-126.34,-126.42,-126.74,-126.74,-126.54,-126.17,-126.13,-127.55,-127.6,-127.58,-127.63,-127.97,-127.64,-127.57,-127.51,-127.45,-127.48,-127.42,-127.36,-127.21,-126.9,-126.98,-127.03,-127.01,-127.13,-127.21,-127.32,-127.22,-126.87,-126.81,-126.81,-126.89,-127.11,-126.71,-126.66,-126.58,-126.56,-126.58,-126.64,-126.73,-126.68,-126.74,-126.73,-126.63,-126.77,-126.5,-126.4,-126.22,-126.04,-126.23,-126.2,-126.22,-126.2,-126.28,-126.19,-126.41,-125.95,-125.78,-125.54,-125.4,-125.35,-125.02,-125.05,-125.11,-125.21,-124.95,-125.01,-125.09,-124.87,-125.11,-125.11,-125.05,-125.06,-125.11,-125.56,-125.57,-125.83,-125.57,-125.58,-125.55,-125.43,-125.38,-125.3,-125.27,-125.05,-124.9,-124.88,-125.06,-125.07,-124.99,-124.97,-124.98,-125.93,-125.59,-125.55,-125.45,-125.34,-125.33,-125.26,-125.27,-125.02,-124.97,-125.06,-125.1,-125.08,-125.04,-125.12,-125.09,-125.07,-125.01,-125.11,-125.54,-126,-125.85,-125.15,-125.17,-125.04,-125.1,-125.11,-124.99,-125.01,-124.99,-125.15,-124.18,-124.21,-124.7,-124.63,-124.7,-124.87,-125.01,-125.15,-125.12,-124.83,-124.76,-124.73,-124.2],10,null,null,{"interactive":true,"className":"","stroke":true,"color":"#03F","weight":5,"opacity":0.5,"fill":true,"fillColor":"#03F","fillOpacity":0.2},null,null,null,{"interactive":false,"permanent":false,"direction":"auto","opacity":1,"offset":[0,0],"textsize":"10px","textOnly":false,"className":"","sticky":true},null,null]}],"limits":{"lat":[49.44,50.95],"lng":[-127.97,-124.18]}},"evals":[],"jsHooks":[]}</script> --- template: leaflet ## Adding color ```r pal <- colorNumeric( palette = as.character(wesanderson::wes_palette(name = "Zissou1", type = "continuous") ), domain = longline_dta$Nyellow) longline_map %>% addCircles(lng = longline_dta$Long, lat = longline_dta$Lat, color = pal(longline_dta$Nyellow)) ``` <div id="htmlwidget-c95cdc071eb6c567e7c1" style="width:504px;height:504px;" class="leaflet html-widget"></div> <script type="application/json" data-for="htmlwidget-c95cdc071eb6c567e7c1">{"x":{"options":{"crs":{"crsClass":"L.CRS.EPSG3857","code":null,"proj4def":null,"projectedBounds":null,"options":{}}},"setView":[[50.5450476190476,-126.216],4,[]],"calls":[{"method":"addTiles","args":["//{s}.tile.openstreetmap.org/{z}/{x}/{y}.png",null,null,{"minZoom":0,"maxZoom":18,"tileSize":256,"subdomains":"abc","errorTileUrl":"","tms":false,"noWrap":false,"zoomOffset":0,"zoomReverse":false,"opacity":1,"zIndex":1,"detectRetina":false,"attribution":"© <a href=\"http://openstreetmap.org\">OpenStreetMap<\/a> contributors, <a href=\"http://creativecommons.org/licenses/by-sa/2.0/\">CC-BY-SA<\/a>"}]},{"method":"addCircles","args":[[50.81,50.88,50.93,50.87,50.89,50.88,50.88,50.84,50.73,50.9,50.87,50.87,50.85,50.8,50.77,50.67,50.72,50.75,50.78,50.8,50.82,50.82,50.77,50.72,50.65,50.61,50.63,50.61,50.67,50.67,50.78,50.8,50.76,50.63,50.71,50.64,50.63,50.63,50.61,50.59,50.7,50.64,50.56,50.54,50.47,50.48,50.61,50.6,50.68,50.73,50.77,50.82,50.84,50.82,50.9,50.87,50.89,50.85,50.81,50.76,50.93,50.91,50.76,50.79,50.77,50.9,50.88,50.84,50.56,50.53,50.51,50.66,50.79,50.78,50.61,50.59,50.61,50.68,50.65,50.46,50.46,50.78,50.8,50.82,50.82,50.89,50.92,50.94,50.95,50.92,50.83,50.87,50.89,50.87,50.76,50.73,50.73,50.68,50.8,50.71,50.7,50.68,50.57,50.59,50.62,50.6,50.62,50.78,50.77,50.83,50.74,50.73,50.72,50.71,50.67,50.6,50.59,50.5,50.54,50.52,50.49,50.5,50.47,50.82,50.81,50.78,50.77,50.62,50.67,50.66,50.45,50.37,50.39,50.46,50.48,50.01,50.04,49.99,50.11,50.43,50.44,50.36,50.59,50.5,50.47,50.47,50.38,50.37,50.58,50.48,50.51,50.48,50.49,50.62,50.44,50.49,50.43,50.46,50.48,50.63,50.63,50.37,50.32,50.35,50.38,50.32,50.45,50.51,50.53,50.44,50.4,50.39,50.5,50.46,50.52,50.51,50.43,50.37,50.32,50.3,50.13,50.11,50.04,50.03,49.99,50.39,50.45,50.4,50.42,50.05,50.26,50.3,50.31,50.33,50.34,50.01,49.94,49.44,49.45,49.5,49.54,49.57,49.74,49.92,49.94,49.91,49.87,49.58,49.52,49.45],[-127.66,-127.64,-127.77,-127.46,-127.42,-127.39,-127.24,-127.09,-127.41,-127.01,-126.68,-126.65,-126.61,-126.81,-126.53,-126.69,-126.78,-126.64,-126.69,-126.57,-126.38,-126.36,-126.21,-126.18,-126.25,-126.33,-126.43,-126.73,-127.15,-126.97,-126.9,-126.88,-126.88,-127.19,-127.21,-127.2,-127.07,-127.05,-126.93,-126.76,-126.86,-126.85,-126.8,-126.77,-126.29,-126.01,-127.08,-126.91,-126.93,-126.98,-126.9,-126.96,-127.09,-127.01,-127,-127.29,-127.39,-127.45,-127.48,-127.41,-127.76,-127.7,-126.8,-126.86,-126.66,-126.78,-126.57,-126.6,-126.76,-126.62,-126.65,-126.39,-126.2,-126.22,-126.34,-126.42,-126.74,-126.74,-126.54,-126.17,-126.13,-127.55,-127.6,-127.58,-127.63,-127.97,-127.64,-127.57,-127.51,-127.45,-127.48,-127.42,-127.36,-127.21,-126.9,-126.98,-127.03,-127.01,-127.13,-127.21,-127.32,-127.22,-126.87,-126.81,-126.81,-126.89,-127.11,-126.71,-126.66,-126.58,-126.56,-126.58,-126.64,-126.73,-126.68,-126.74,-126.73,-126.63,-126.77,-126.5,-126.4,-126.22,-126.04,-126.23,-126.2,-126.22,-126.2,-126.28,-126.19,-126.41,-125.95,-125.78,-125.54,-125.4,-125.35,-125.02,-125.05,-125.11,-125.21,-124.95,-125.01,-125.09,-124.87,-125.11,-125.11,-125.05,-125.06,-125.11,-125.56,-125.57,-125.83,-125.57,-125.58,-125.55,-125.43,-125.38,-125.3,-125.27,-125.05,-124.9,-124.88,-125.06,-125.07,-124.99,-124.97,-124.98,-125.93,-125.59,-125.55,-125.45,-125.34,-125.33,-125.26,-125.27,-125.02,-124.97,-125.06,-125.1,-125.08,-125.04,-125.12,-125.09,-125.07,-125.01,-125.11,-125.54,-126,-125.85,-125.15,-125.17,-125.04,-125.1,-125.11,-124.99,-125.01,-124.99,-125.15,-124.18,-124.21,-124.7,-124.63,-124.7,-124.87,-125.01,-125.15,-125.12,-124.83,-124.76,-124.73,-124.2],10,null,null,{"interactive":true,"className":"","stroke":true,"color":["#78B7C5","#3B9AB2","#5CA8BB","#3B9AB2","#52A4B8","#479FB5","#479FB5","#479FB5","#3B9AB2","#3B9AB2","#3B9AB2","#3B9AB2","#479FB5","#3B9AB2","#5CA8BB","#3B9AB2","#6FB2C2","#3B9AB2","#5CA8BB","#3B9AB2","#66ADBF","#EBCC2A","#52A4B8","#3B9AB2","#3B9AB2","#3B9AB2","#3B9AB2","#3B9AB2","#3B9AB2","#3B9AB2","#479FB5","#3B9AB2","#3B9AB2","#3B9AB2","#3B9AB2","#3B9AB2","#3B9AB2","#3B9AB2","#3B9AB2","#3B9AB2","#3B9AB2","#3B9AB2","#3B9AB2","#5CA8BB","#CFC56A","#5CA8BB","#3B9AB2","#3B9AB2","#479FB5","#3B9AB2","#3B9AB2","#3B9AB2","#52A4B8","#3B9AB2","#479FB5","#3B9AB2","#52A4B8","#66ADBF","#3B9AB2","#479FB5","#3B9AB2","#3B9AB2","#52A4B8","#3B9AB2","#52A4B8","#66ADBF","#479FB5","#5CA8BB","#479FB5","#ACBE99","#66ADBF","#3B9AB2","#3B9AB2","#3B9AB2","#3B9AB2","#3B9AB2","#3B9AB2","#3B9AB2","#3B9AB2","#5CA8BB","#EBCC2A","#3B9AB2","#479FB5","#6FB2C2","#52A4B8","#3B9AB2","#EBCC2A","#E6BD1A","#479FB5","#3B9AB2","#3B9AB2","#5CA8BB","#78B7C5","#66ADBF","#52A4B8","#479FB5","#479FB5","#3B9AB2","#3B9AB2","#3B9AB2","#3B9AB2","#3B9AB2","#3B9AB2","#3B9AB2","#3B9AB2","#3B9AB2","#3B9AB2","#5CA8BB","#479FB5","#78B7C5","#3B9AB2","#3B9AB2","#3B9AB2","#3B9AB2","#3B9AB2","#3B9AB2","#479FB5","#479FB5","#78B7C5","#CFC56A","#3B9AB2","#479FB5","#3B9AB2","#BFC182","#479FB5","#3B9AB2","#479FB5","#3B9AB2","#3B9AB2","#3B9AB2","#3B9AB2","#3B9AB2","#3B9AB2","#479FB5","#3B9AB2","#66ADBF","#52A4B8","#3B9AB2","#3B9AB2","#E3B40A","#F21A00","#EBCC2A","#3B9AB2","#BFC182","#3B9AB2","#3B9AB2","#78B7C5","#78B7C5","#66ADBF","#6FB2C2","#3B9AB2","#3B9AB2","#78B7C5","#EBCC2A","#6FB2C2","#3B9AB2","#479FB5","#96BAAF","#96BAAF","#6FB2C2","#6FB2C2","#96BAAF","#96BAAF","#96BAAF","#5CA8BB","#52A4B8","#3B9AB2","#5CA8BB","#3B9AB2","#479FB5","#6FB2C2","#52A4B8","#3B9AB2","#3B9AB2","#479FB5","#6FB2C2","#96BAAF","#52A4B8","#66ADBF","#479FB5","#479FB5","#3B9AB2","#3B9AB2","#3B9AB2","#3B9AB2","#3B9AB2","#52A4B8","#3B9AB2","#3B9AB2","#52A4B8","#5CA8BB","#66ADBF","#479FB5","#96BAAF","#52A4B8","#479FB5","#3B9AB2","#3B9AB2","#78B7C5","#3B9AB2","#E4B913","#3B9AB2","#3B9AB2","#5CA8BB","#3B9AB2","#3B9AB2","#479FB5","#3B9AB2","#3B9AB2","#DEC84F"],"weight":5,"opacity":0.5,"fill":true,"fillColor":["#78B7C5","#3B9AB2","#5CA8BB","#3B9AB2","#52A4B8","#479FB5","#479FB5","#479FB5","#3B9AB2","#3B9AB2","#3B9AB2","#3B9AB2","#479FB5","#3B9AB2","#5CA8BB","#3B9AB2","#6FB2C2","#3B9AB2","#5CA8BB","#3B9AB2","#66ADBF","#EBCC2A","#52A4B8","#3B9AB2","#3B9AB2","#3B9AB2","#3B9AB2","#3B9AB2","#3B9AB2","#3B9AB2","#479FB5","#3B9AB2","#3B9AB2","#3B9AB2","#3B9AB2","#3B9AB2","#3B9AB2","#3B9AB2","#3B9AB2","#3B9AB2","#3B9AB2","#3B9AB2","#3B9AB2","#5CA8BB","#CFC56A","#5CA8BB","#3B9AB2","#3B9AB2","#479FB5","#3B9AB2","#3B9AB2","#3B9AB2","#52A4B8","#3B9AB2","#479FB5","#3B9AB2","#52A4B8","#66ADBF","#3B9AB2","#479FB5","#3B9AB2","#3B9AB2","#52A4B8","#3B9AB2","#52A4B8","#66ADBF","#479FB5","#5CA8BB","#479FB5","#ACBE99","#66ADBF","#3B9AB2","#3B9AB2","#3B9AB2","#3B9AB2","#3B9AB2","#3B9AB2","#3B9AB2","#3B9AB2","#5CA8BB","#EBCC2A","#3B9AB2","#479FB5","#6FB2C2","#52A4B8","#3B9AB2","#EBCC2A","#E6BD1A","#479FB5","#3B9AB2","#3B9AB2","#5CA8BB","#78B7C5","#66ADBF","#52A4B8","#479FB5","#479FB5","#3B9AB2","#3B9AB2","#3B9AB2","#3B9AB2","#3B9AB2","#3B9AB2","#3B9AB2","#3B9AB2","#3B9AB2","#3B9AB2","#5CA8BB","#479FB5","#78B7C5","#3B9AB2","#3B9AB2","#3B9AB2","#3B9AB2","#3B9AB2","#3B9AB2","#479FB5","#479FB5","#78B7C5","#CFC56A","#3B9AB2","#479FB5","#3B9AB2","#BFC182","#479FB5","#3B9AB2","#479FB5","#3B9AB2","#3B9AB2","#3B9AB2","#3B9AB2","#3B9AB2","#3B9AB2","#479FB5","#3B9AB2","#66ADBF","#52A4B8","#3B9AB2","#3B9AB2","#E3B40A","#F21A00","#EBCC2A","#3B9AB2","#BFC182","#3B9AB2","#3B9AB2","#78B7C5","#78B7C5","#66ADBF","#6FB2C2","#3B9AB2","#3B9AB2","#78B7C5","#EBCC2A","#6FB2C2","#3B9AB2","#479FB5","#96BAAF","#96BAAF","#6FB2C2","#6FB2C2","#96BAAF","#96BAAF","#96BAAF","#5CA8BB","#52A4B8","#3B9AB2","#5CA8BB","#3B9AB2","#479FB5","#6FB2C2","#52A4B8","#3B9AB2","#3B9AB2","#479FB5","#6FB2C2","#96BAAF","#52A4B8","#66ADBF","#479FB5","#479FB5","#3B9AB2","#3B9AB2","#3B9AB2","#3B9AB2","#3B9AB2","#52A4B8","#3B9AB2","#3B9AB2","#52A4B8","#5CA8BB","#66ADBF","#479FB5","#96BAAF","#52A4B8","#479FB5","#3B9AB2","#3B9AB2","#78B7C5","#3B9AB2","#E4B913","#3B9AB2","#3B9AB2","#5CA8BB","#3B9AB2","#3B9AB2","#479FB5","#3B9AB2","#3B9AB2","#DEC84F"],"fillOpacity":0.2},null,null,null,{"interactive":false,"permanent":false,"direction":"auto","opacity":1,"offset":[0,0],"textsize":"10px","textOnly":false,"className":"","sticky":true},null,null]}],"limits":{"lat":[49.44,50.95],"lng":[-127.97,-124.18]}},"evals":[],"jsHooks":[]}</script> --- template: leaflet ## Adapting circles size ```r pal <- colorNumeric( palette = as.character(wesanderson::wes_palette(name = "Zissou1", type = "continuous") ), domain = longline_dta$Nyellow) longline_map %>% addCircleMarkers(lng = longline_dta$Long, lat = longline_dta$Lat, color = pal(longline_dta$Nyellow), radius = longline_dta$Nyellow, stroke = FALSE, fillOpacity = 0.5, popup = longline_dta$Nyellow) ``` <div id="htmlwidget-4a31d8c029c10c9cc97c" style="width:504px;height:504px;" class="leaflet html-widget"></div> <script type="application/json" data-for="htmlwidget-4a31d8c029c10c9cc97c">{"x":{"options":{"crs":{"crsClass":"L.CRS.EPSG3857","code":null,"proj4def":null,"projectedBounds":null,"options":{}}},"setView":[[50.5450476190476,-126.216],4,[]],"calls":[{"method":"addTiles","args":["//{s}.tile.openstreetmap.org/{z}/{x}/{y}.png",null,null,{"minZoom":0,"maxZoom":18,"tileSize":256,"subdomains":"abc","errorTileUrl":"","tms":false,"noWrap":false,"zoomOffset":0,"zoomReverse":false,"opacity":1,"zIndex":1,"detectRetina":false,"attribution":"© <a href=\"http://openstreetmap.org\">OpenStreetMap<\/a> contributors, <a href=\"http://creativecommons.org/licenses/by-sa/2.0/\">CC-BY-SA<\/a>"}]},{"method":"addCircleMarkers","args":[[50.81,50.88,50.93,50.87,50.89,50.88,50.88,50.84,50.73,50.9,50.87,50.87,50.85,50.8,50.77,50.67,50.72,50.75,50.78,50.8,50.82,50.82,50.77,50.72,50.65,50.61,50.63,50.61,50.67,50.67,50.78,50.8,50.76,50.63,50.71,50.64,50.63,50.63,50.61,50.59,50.7,50.64,50.56,50.54,50.47,50.48,50.61,50.6,50.68,50.73,50.77,50.82,50.84,50.82,50.9,50.87,50.89,50.85,50.81,50.76,50.93,50.91,50.76,50.79,50.77,50.9,50.88,50.84,50.56,50.53,50.51,50.66,50.79,50.78,50.61,50.59,50.61,50.68,50.65,50.46,50.46,50.78,50.8,50.82,50.82,50.89,50.92,50.94,50.95,50.92,50.83,50.87,50.89,50.87,50.76,50.73,50.73,50.68,50.8,50.71,50.7,50.68,50.57,50.59,50.62,50.6,50.62,50.78,50.77,50.83,50.74,50.73,50.72,50.71,50.67,50.6,50.59,50.5,50.54,50.52,50.49,50.5,50.47,50.82,50.81,50.78,50.77,50.62,50.67,50.66,50.45,50.37,50.39,50.46,50.48,50.01,50.04,49.99,50.11,50.43,50.44,50.36,50.59,50.5,50.47,50.47,50.38,50.37,50.58,50.48,50.51,50.48,50.49,50.62,50.44,50.49,50.43,50.46,50.48,50.63,50.63,50.37,50.32,50.35,50.38,50.32,50.45,50.51,50.53,50.44,50.4,50.39,50.5,50.46,50.52,50.51,50.43,50.37,50.32,50.3,50.13,50.11,50.04,50.03,49.99,50.39,50.45,50.4,50.42,50.05,50.26,50.3,50.31,50.33,50.34,50.01,49.94,49.44,49.45,49.5,49.54,49.57,49.74,49.92,49.94,49.91,49.87,49.58,49.52,49.45],[-127.66,-127.64,-127.77,-127.46,-127.42,-127.39,-127.24,-127.09,-127.41,-127.01,-126.68,-126.65,-126.61,-126.81,-126.53,-126.69,-126.78,-126.64,-126.69,-126.57,-126.38,-126.36,-126.21,-126.18,-126.25,-126.33,-126.43,-126.73,-127.15,-126.97,-126.9,-126.88,-126.88,-127.19,-127.21,-127.2,-127.07,-127.05,-126.93,-126.76,-126.86,-126.85,-126.8,-126.77,-126.29,-126.01,-127.08,-126.91,-126.93,-126.98,-126.9,-126.96,-127.09,-127.01,-127,-127.29,-127.39,-127.45,-127.48,-127.41,-127.76,-127.7,-126.8,-126.86,-126.66,-126.78,-126.57,-126.6,-126.76,-126.62,-126.65,-126.39,-126.2,-126.22,-126.34,-126.42,-126.74,-126.74,-126.54,-126.17,-126.13,-127.55,-127.6,-127.58,-127.63,-127.97,-127.64,-127.57,-127.51,-127.45,-127.48,-127.42,-127.36,-127.21,-126.9,-126.98,-127.03,-127.01,-127.13,-127.21,-127.32,-127.22,-126.87,-126.81,-126.81,-126.89,-127.11,-126.71,-126.66,-126.58,-126.56,-126.58,-126.64,-126.73,-126.68,-126.74,-126.73,-126.63,-126.77,-126.5,-126.4,-126.22,-126.04,-126.23,-126.2,-126.22,-126.2,-126.28,-126.19,-126.41,-125.95,-125.78,-125.54,-125.4,-125.35,-125.02,-125.05,-125.11,-125.21,-124.95,-125.01,-125.09,-124.87,-125.11,-125.11,-125.05,-125.06,-125.11,-125.56,-125.57,-125.83,-125.57,-125.58,-125.55,-125.43,-125.38,-125.3,-125.27,-125.05,-124.9,-124.88,-125.06,-125.07,-124.99,-124.97,-124.98,-125.93,-125.59,-125.55,-125.45,-125.34,-125.33,-125.26,-125.27,-125.02,-124.97,-125.06,-125.1,-125.08,-125.04,-125.12,-125.09,-125.07,-125.01,-125.11,-125.54,-126,-125.85,-125.15,-125.17,-125.04,-125.1,-125.11,-124.99,-125.01,-124.99,-125.15,-124.18,-124.21,-124.7,-124.63,-124.7,-124.87,-125.01,-125.15,-125.12,-124.83,-124.76,-124.73,-124.2],[6,0,3,0,2,1,1,1,0,0,0,0,1,0,3,0,5,0,3,0,4,12,2,0,0,0,0,0,0,0,1,0,0,0,0,0,0,0,0,0,0,0,0,3,10,3,0,0,1,0,0,0,2,0,1,0,2,4,0,1,0,0,2,0,2,4,1,3,1,8,4,0,0,0,0,0,0,0,0,3,12,0,1,5,2,0,12,15,1,0,0,3,6,4,2,1,1,0,0,0,0,0,0,0,0,0,0,3,1,6,0,0,0,0,0,0,1,1,6,10,0,1,0,9,1,0,1,0,0,0,0,0,0,1,0,4,2,0,0,17,24,12,0,9,0,0,6,6,4,5,0,0,6,12,5,0,1,7,7,5,5,7,7,7,3,2,0,3,0,1,5,2,0,0,1,5,7,2,4,1,1,0,0,0,0,0,2,0,0,2,3,4,1,7,2,1,0,0,6,0,16,0,0,3,0,0,1,0,0,11],null,null,{"interactive":true,"className":"","stroke":false,"color":["#78B7C5","#3B9AB2","#5CA8BB","#3B9AB2","#52A4B8","#479FB5","#479FB5","#479FB5","#3B9AB2","#3B9AB2","#3B9AB2","#3B9AB2","#479FB5","#3B9AB2","#5CA8BB","#3B9AB2","#6FB2C2","#3B9AB2","#5CA8BB","#3B9AB2","#66ADBF","#EBCC2A","#52A4B8","#3B9AB2","#3B9AB2","#3B9AB2","#3B9AB2","#3B9AB2","#3B9AB2","#3B9AB2","#479FB5","#3B9AB2","#3B9AB2","#3B9AB2","#3B9AB2","#3B9AB2","#3B9AB2","#3B9AB2","#3B9AB2","#3B9AB2","#3B9AB2","#3B9AB2","#3B9AB2","#5CA8BB","#CFC56A","#5CA8BB","#3B9AB2","#3B9AB2","#479FB5","#3B9AB2","#3B9AB2","#3B9AB2","#52A4B8","#3B9AB2","#479FB5","#3B9AB2","#52A4B8","#66ADBF","#3B9AB2","#479FB5","#3B9AB2","#3B9AB2","#52A4B8","#3B9AB2","#52A4B8","#66ADBF","#479FB5","#5CA8BB","#479FB5","#ACBE99","#66ADBF","#3B9AB2","#3B9AB2","#3B9AB2","#3B9AB2","#3B9AB2","#3B9AB2","#3B9AB2","#3B9AB2","#5CA8BB","#EBCC2A","#3B9AB2","#479FB5","#6FB2C2","#52A4B8","#3B9AB2","#EBCC2A","#E6BD1A","#479FB5","#3B9AB2","#3B9AB2","#5CA8BB","#78B7C5","#66ADBF","#52A4B8","#479FB5","#479FB5","#3B9AB2","#3B9AB2","#3B9AB2","#3B9AB2","#3B9AB2","#3B9AB2","#3B9AB2","#3B9AB2","#3B9AB2","#3B9AB2","#5CA8BB","#479FB5","#78B7C5","#3B9AB2","#3B9AB2","#3B9AB2","#3B9AB2","#3B9AB2","#3B9AB2","#479FB5","#479FB5","#78B7C5","#CFC56A","#3B9AB2","#479FB5","#3B9AB2","#BFC182","#479FB5","#3B9AB2","#479FB5","#3B9AB2","#3B9AB2","#3B9AB2","#3B9AB2","#3B9AB2","#3B9AB2","#479FB5","#3B9AB2","#66ADBF","#52A4B8","#3B9AB2","#3B9AB2","#E3B40A","#F21A00","#EBCC2A","#3B9AB2","#BFC182","#3B9AB2","#3B9AB2","#78B7C5","#78B7C5","#66ADBF","#6FB2C2","#3B9AB2","#3B9AB2","#78B7C5","#EBCC2A","#6FB2C2","#3B9AB2","#479FB5","#96BAAF","#96BAAF","#6FB2C2","#6FB2C2","#96BAAF","#96BAAF","#96BAAF","#5CA8BB","#52A4B8","#3B9AB2","#5CA8BB","#3B9AB2","#479FB5","#6FB2C2","#52A4B8","#3B9AB2","#3B9AB2","#479FB5","#6FB2C2","#96BAAF","#52A4B8","#66ADBF","#479FB5","#479FB5","#3B9AB2","#3B9AB2","#3B9AB2","#3B9AB2","#3B9AB2","#52A4B8","#3B9AB2","#3B9AB2","#52A4B8","#5CA8BB","#66ADBF","#479FB5","#96BAAF","#52A4B8","#479FB5","#3B9AB2","#3B9AB2","#78B7C5","#3B9AB2","#E4B913","#3B9AB2","#3B9AB2","#5CA8BB","#3B9AB2","#3B9AB2","#479FB5","#3B9AB2","#3B9AB2","#DEC84F"],"weight":5,"opacity":0.5,"fill":true,"fillColor":["#78B7C5","#3B9AB2","#5CA8BB","#3B9AB2","#52A4B8","#479FB5","#479FB5","#479FB5","#3B9AB2","#3B9AB2","#3B9AB2","#3B9AB2","#479FB5","#3B9AB2","#5CA8BB","#3B9AB2","#6FB2C2","#3B9AB2","#5CA8BB","#3B9AB2","#66ADBF","#EBCC2A","#52A4B8","#3B9AB2","#3B9AB2","#3B9AB2","#3B9AB2","#3B9AB2","#3B9AB2","#3B9AB2","#479FB5","#3B9AB2","#3B9AB2","#3B9AB2","#3B9AB2","#3B9AB2","#3B9AB2","#3B9AB2","#3B9AB2","#3B9AB2","#3B9AB2","#3B9AB2","#3B9AB2","#5CA8BB","#CFC56A","#5CA8BB","#3B9AB2","#3B9AB2","#479FB5","#3B9AB2","#3B9AB2","#3B9AB2","#52A4B8","#3B9AB2","#479FB5","#3B9AB2","#52A4B8","#66ADBF","#3B9AB2","#479FB5","#3B9AB2","#3B9AB2","#52A4B8","#3B9AB2","#52A4B8","#66ADBF","#479FB5","#5CA8BB","#479FB5","#ACBE99","#66ADBF","#3B9AB2","#3B9AB2","#3B9AB2","#3B9AB2","#3B9AB2","#3B9AB2","#3B9AB2","#3B9AB2","#5CA8BB","#EBCC2A","#3B9AB2","#479FB5","#6FB2C2","#52A4B8","#3B9AB2","#EBCC2A","#E6BD1A","#479FB5","#3B9AB2","#3B9AB2","#5CA8BB","#78B7C5","#66ADBF","#52A4B8","#479FB5","#479FB5","#3B9AB2","#3B9AB2","#3B9AB2","#3B9AB2","#3B9AB2","#3B9AB2","#3B9AB2","#3B9AB2","#3B9AB2","#3B9AB2","#5CA8BB","#479FB5","#78B7C5","#3B9AB2","#3B9AB2","#3B9AB2","#3B9AB2","#3B9AB2","#3B9AB2","#479FB5","#479FB5","#78B7C5","#CFC56A","#3B9AB2","#479FB5","#3B9AB2","#BFC182","#479FB5","#3B9AB2","#479FB5","#3B9AB2","#3B9AB2","#3B9AB2","#3B9AB2","#3B9AB2","#3B9AB2","#479FB5","#3B9AB2","#66ADBF","#52A4B8","#3B9AB2","#3B9AB2","#E3B40A","#F21A00","#EBCC2A","#3B9AB2","#BFC182","#3B9AB2","#3B9AB2","#78B7C5","#78B7C5","#66ADBF","#6FB2C2","#3B9AB2","#3B9AB2","#78B7C5","#EBCC2A","#6FB2C2","#3B9AB2","#479FB5","#96BAAF","#96BAAF","#6FB2C2","#6FB2C2","#96BAAF","#96BAAF","#96BAAF","#5CA8BB","#52A4B8","#3B9AB2","#5CA8BB","#3B9AB2","#479FB5","#6FB2C2","#52A4B8","#3B9AB2","#3B9AB2","#479FB5","#6FB2C2","#96BAAF","#52A4B8","#66ADBF","#479FB5","#479FB5","#3B9AB2","#3B9AB2","#3B9AB2","#3B9AB2","#3B9AB2","#52A4B8","#3B9AB2","#3B9AB2","#52A4B8","#5CA8BB","#66ADBF","#479FB5","#96BAAF","#52A4B8","#479FB5","#3B9AB2","#3B9AB2","#78B7C5","#3B9AB2","#E4B913","#3B9AB2","#3B9AB2","#5CA8BB","#3B9AB2","#3B9AB2","#479FB5","#3B9AB2","#3B9AB2","#DEC84F"],"fillOpacity":0.5},null,null,[6,0,3,0,2,1,1,1,0,0,0,0,1,0,3,0,5,0,3,0,4,12,2,0,0,0,0,0,0,0,1,0,0,0,0,0,0,0,0,0,0,0,0,3,10,3,0,0,1,0,0,0,2,0,1,0,2,4,0,1,0,0,2,0,2,4,1,3,1,8,4,0,0,0,0,0,0,0,0,3,12,0,1,5,2,0,12,15,1,0,0,3,6,4,2,1,1,0,0,0,0,0,0,0,0,0,0,3,1,6,0,0,0,0,0,0,1,1,6,10,0,1,0,9,1,0,1,0,0,0,0,0,0,1,0,4,2,0,0,17,24,12,0,9,0,0,6,6,4,5,0,0,6,12,5,0,1,7,7,5,5,7,7,7,3,2,0,3,0,1,5,2,0,0,1,5,7,2,4,1,1,0,0,0,0,0,2,0,0,2,3,4,1,7,2,1,0,0,6,0,16,0,0,3,0,0,1,0,0,11],null,null,{"interactive":false,"permanent":false,"direction":"auto","opacity":1,"offset":[0,0],"textsize":"10px","textOnly":false,"className":"","sticky":true},null]}],"limits":{"lat":[49.44,50.95],"lng":[-127.97,-124.18]}},"evals":[],"jsHooks":[]}</script> --- ### Exercise Get the data the Coronavirus data available [here](https://raw.githubusercontent.com/opencovid19-fr/data/master/dist/chiffres-cles.csv) By group ate the regio scale, propose the map of a region to illustarte 5 key moemnts of the pandemy. --- # References Pebesma, E. (2018). "Simple Features for R: Standardized Support for Spatial Vector Data". In: _The R Journal_ 10.1, pp. 439-446. DOI: [10.32614/RJ-2018-009](https://doi.org/10.32614%2FRJ-2018-009). URL: [https://doi.org/10.32614/RJ-2018-009](https://doi.org/10.32614/RJ-2018-009).