class: center, middle, inverse, title-slide # Visualisation de données ## <br> Pourquoi et comment ? ### Marie-Pierre Etienne ### <a href="https://marieetienne.github.io/" class="uri">https://marieetienne.github.io/</a> ### 2020/09/11 (updated: 2022-10-28) --- name: intro count: false # Introduction --- template: intro ## Pourquoi la visualisation des données est importante ? <br> <br> - La chronique de Constance par Constance dans Par Jupiter <br> <audio controls> <source src="../resources/audio/2020_10_27_Constance_Par_Jupiter.mp3" type="audio/mpeg"> <source src="../resources/audio/2020_10_27_Constance_Par_Jupiter" type="audio/ogg"/> </audio> --- template: intro ## Un exemple inspirant : le réchauffement climatique en une image <img src="../resources/img/lemonde_rechauffement.png" width="849" height="60%" /> [Extrait du journal Le Monde le 3 janvier 2020](https://www.lemonde.fr/les-decodeurs/article/2020/01/03/2019-est-la-troisieme-annee-la-plus-chaude-en-france-visualisez-la-hausse-dans-votre-ville_6024699_4355770.html?xtor=CS2-33281034-%5BKW%5D-%5Bgratuit%5D-%5Barticleacquisition%5D&utm_campaign=keywee_acquisition&utm_medium=PaidSocial&utm_source=Facebook&kwp_0=1527732&kwp_4=4629376&kwp_1=1961091) -- <p class="question"> Qu'est ce qui est efficace dans cette visualisation ? </p> --- template: intro ## Le musée des horreurs - [Le pourcentage de fumeurs aux Pays-Bas](https://viz.wtf/image/630887965804150786) <img src="../resources/img/smockers.png" width="1312" height="60%" /> --- template: intro count: false ## Le musée des horreurs - [Le Tumblr WTFViz](https://viz.wtf/) - [Probabilité d'infection par le coronavirus par G. Forestier](https://i.redd.it/b3vvel2xtsv51.jpg) <img src="../resources/img/corona_gf.png" width="1836" height="40%" /> - [Incidence par G. Forestier (CovidTracker)](https://raw.githubusercontent.com/CovidTrackerFr/covidtracker-data/master/../resources/img/charts/france/heatmaps_deps/heatmap_taux_35.jpeg) --- template: intro count: false ## Le musée des horreurs - [Le Tumblr WTFViz](https://viz.wtf/) - [Probabilité d'infection par le coronavirus par G. Forestier](https://i.redd.it/b3vvel2xtsv51.jpg) - [Le coronavirus par Jean Castex](https://www.ouest-france.fr/sante/virus/coronavirus/covid-19-couvre-feu-que-voulaient-dire-les-droles-de-graphiques-montres-par-jean-castex-7016245) <img src="../resources/img/corona_j_castex.png" width="1115" height="60%" /> --- template: intro ## Quels sont les éléments d'une visualisation efficace ? - $$ $$ - $$ $$ - $$ $$ - $$ $$ - $$ $$ - $$ $$ - $$ $$ -- .care[ Objectif du jour :] Acquérir des outils pour gérer ces différents aspects --- template: intro ## Some resources - [Data visualization with R](https://rkabacoff.github.io/datavis/) - [R for Data Science](https://r4ds.had.co.nz/) [WG17] - [R Graphics Cookbook](http://www.cookbook-r.com/) - [ggplot2: Elegant Graphics for Data Analysis](https://ggplot2-book.org/index.html) [Wic16] - [R graph gallery](https://www.r-graph-gallery.com/ggplot2-package.html) - [Tutoriel de Raphaelle Momal et Marie Perrot Dockes](https://stateofther.github.io/post/fancy-plotting/) - [Don’t cha wish your ggplot had colours like me?](https://www.dataembassy.co.nz/Liza-colours-in-R#22) - [Valoriser ses données avec R](https://mtes-mct.github.io/parcours-r/m5/) (formation du Ministere de la Transition Écologique et Solidaire (MTES) et du Ministère de la Cohésion des Territoires et des relations avec les collectivités territoriales (MCTRCT)) --- name: manip # Data manipulation --- template: manip The tidyverse is designed to facilitate data manipulation and we will use the `%>%` operator. ```r library(tidyverse) ``` <img src="../resources/img/data-science.png" width="60%" height="40%" /> --- template: manip The tidyverse is designed to facilitate data manipulation and we will use the `%>%` operator. ```r library(tidyverse) ``` <div class="figure"> <img src="../resources/img/tidyverse.png" alt="Extract from https://mtes-mct.github.io/parcours-r/m5/package-ggplot2.html" width="80%" height="60%" /> <p class="caption">Extract from https://mtes-mct.github.io/parcours-r/m5/package-ggplot2.html</p> </div> --- template: manip ## The %>% operator ```r set.seed(1) n <- 8 data.frame(x = sample(1:10, size = n, replace = TRUE), y = 3*rnorm(n)) %>% mutate(xplusy = x + y ) %>% filter( xplusy > 4) %>% select(x, y) ``` --- --- count: false .panel1-tidy_ex-auto[ ```r *set.seed(1) ``` ] .panel2-tidy_ex-auto[ ] --- count: false .panel1-tidy_ex-auto[ ```r set.seed(1) *n <- 8 ``` ] .panel2-tidy_ex-auto[ ] --- count: false .panel1-tidy_ex-auto[ ```r set.seed(1) n <- 8 *data.frame(x = sample(1:10, size = n, replace = TRUE), y = 3*rnorm(n)) ``` ] .panel2-tidy_ex-auto[ ``` ## x y ## 1 9 1.4622872 ## 2 4 2.2149741 ## 3 7 1.7273441 ## 4 1 -0.9161652 ## 5 2 4.5353435 ## 6 7 1.1695297 ## 7 2 -1.8637217 ## 8 3 -6.6440997 ``` ] --- count: false .panel1-tidy_ex-auto[ ```r set.seed(1) n <- 8 data.frame(x = sample(1:10, size = n, replace = TRUE), y = 3*rnorm(n)) %>% * mutate(xplusy = x + y ) ``` ] .panel2-tidy_ex-auto[ ``` ## x y xplusy ## 1 9 1.4622872 10.46228716 ## 2 4 2.2149741 6.21497412 ## 3 7 1.7273441 8.72734405 ## 4 1 -0.9161652 0.08383484 ## 5 2 4.5353435 6.53534351 ## 6 7 1.1695297 8.16952971 ## 7 2 -1.8637217 0.13627826 ## 8 3 -6.6440997 -3.64409966 ``` ] --- count: false .panel1-tidy_ex-auto[ ```r set.seed(1) n <- 8 data.frame(x = sample(1:10, size = n, replace = TRUE), y = 3*rnorm(n)) %>% mutate(xplusy = x + y ) %>% * filter( xplusy > 4) ``` ] .panel2-tidy_ex-auto[ ``` ## x y xplusy ## 1 9 1.462287 10.462287 ## 2 4 2.214974 6.214974 ## 3 7 1.727344 8.727344 ## 4 2 4.535344 6.535344 ## 5 7 1.169530 8.169530 ``` ] --- count: false .panel1-tidy_ex-auto[ ```r set.seed(1) n <- 8 data.frame(x = sample(1:10, size = n, replace = TRUE), y = 3*rnorm(n)) %>% mutate(xplusy = x + y ) %>% filter( xplusy > 4) %>% * select(x, y) ``` ] .panel2-tidy_ex-auto[ ``` ## x y ## 1 9 1.462287 ## 2 4 2.214974 ## 3 7 1.727344 ## 4 2 4.535344 ## 5 7 1.169530 ``` ] <style> .panel1-tidy_ex-auto { color: black; width: 38.6060606060606%; hight: 32%; float: left; padding-left: 1%; font-size: 80% } .panel2-tidy_ex-auto { color: black; width: 59.3939393939394%; hight: 32%; float: left; padding-left: 1%; font-size: 80% } .panel3-tidy_ex-auto { color: black; width: NA%; hight: 33%; float: left; padding-left: 1%; font-size: 80% } </style> --- template: manip ## Useful commands - `mutate` to create a new column, - `filter` to select lines according to some conditions, - `select` to select some columss, -- - `rename` to rename variables, - `group_by` for grouping factor, - `summarise` to cumputate summary statistics, - ... --- template: manip ## First running example: The Palmer Penguins dataset ```r #remotes::install_github("allisonhorst/palmerpenguins") data(penguins,package = "palmerpenguins") penguins <- penguins %>% rename(bill_l = bill_length_mm, bill_d = bill_depth_mm, flip_l = flipper_length_mm, bm = body_mass_g) penguins %>% print(n=2) ``` ``` ## # A tibble: 344 × 8 ## species island bill_l bill_d flip_l bm sex year ## <fct> <fct> <dbl> <dbl> <int> <int> <fct> <int> ## 1 Adelie Torgersen 39.1 18.7 181 3750 male 2007 ## 2 Adelie Torgersen 39.5 17.4 186 3800 female 2007 ## # … with 342 more rows ``` --- template: manip ## A case study running example: The bats dataset ```r data(bats,package = "coursesdata") bats %>% as_tibble() %>% print(n = 2, na.print = NULL) ``` ``` ## # A tibble: 63 × 8 ## Species Diet Clade BOW BRW AUD MOB HIP ## <chr> <int> <chr> <dbl> <dbl> <dbl> <dbl> <dbl> ## 1 " Rousettus aegyptiacus " 1 I 136. 2070 9.88 106. 126. ## 2 " Epomops franqueti " 1 I 120 2210 10.4 108. 160. ## # … with 61 more rows ``` --- template: manip ## Combining group_by, mutate and summarise ```r penguins %>% group_by(species, sex, year, island) %>% mutate(n = n()) %>% summarise_if(is.numeric, mean, na.rm = TRUE) %>% print(n=10) ``` ``` ## # A tibble: 35 × 9 ## # Groups: species, sex, year [22] ## species sex year island bill_l bill_d flip_l bm n ## <fct> <fct> <int> <fct> <dbl> <dbl> <dbl> <dbl> <dbl> ## 1 Adelie female 2007 Biscoe 37.5 18.6 182. 3470 5 ## 2 Adelie female 2007 Dream 37.9 17.8 185 3269. 9 ## 3 Adelie female 2007 Torgersen 38.3 18.2 188. 3475 8 ## 4 Adelie female 2008 Biscoe 36.6 17.2 187. 3244. 9 ## 5 Adelie female 2008 Dream 36.3 17.8 189 3412. 8 ## 6 Adelie female 2008 Torgersen 36.6 17.4 190 3519. 8 ## 7 Adelie female 2009 Biscoe 38.1 17.7 191. 3447. 8 ## 8 Adelie female 2009 Dream 36.6 17.3 190. 3358. 10 ## 9 Adelie female 2009 Torgersen 37.8 17.1 187. 3194. 8 ## 10 Adelie male 2007 Biscoe 39.2 18.3 182. 3770 5 ## # … with 25 more rows ``` --- count: false .panel1-show_data_palmer_flip-auto[ ```r *penguins ``` ] .panel2-show_data_palmer_flip-auto[ ``` ## # A tibble: 344 × 8 ## species island bill_l bill_d flip_l bm sex year ## <fct> <fct> <dbl> <dbl> <int> <int> <fct> <int> ## 1 Adelie Torgersen 39.1 18.7 181 3750 male 2007 ## 2 Adelie Torgersen 39.5 17.4 186 3800 female 2007 ## 3 Adelie Torgersen 40.3 18 195 3250 female 2007 ## 4 Adelie Torgersen NA NA NA NA <NA> 2007 ## 5 Adelie Torgersen 36.7 19.3 193 3450 female 2007 ## 6 Adelie Torgersen 39.3 20.6 190 3650 male 2007 ## 7 Adelie Torgersen 38.9 17.8 181 3625 female 2007 ## 8 Adelie Torgersen 39.2 19.6 195 4675 male 2007 ## 9 Adelie Torgersen 34.1 18.1 193 3475 <NA> 2007 ## 10 Adelie Torgersen 42 20.2 190 4250 <NA> 2007 ## # … with 334 more rows ``` ] --- count: false .panel1-show_data_palmer_flip-auto[ ```r penguins %>% * group_by(species, sex, year, island) ``` ] .panel2-show_data_palmer_flip-auto[ ``` ## # A tibble: 344 × 8 ## # Groups: species, sex, year, island [35] ## species island bill_l bill_d flip_l bm sex year ## <fct> <fct> <dbl> <dbl> <int> <int> <fct> <int> ## 1 Adelie Torgersen 39.1 18.7 181 3750 male 2007 ## 2 Adelie Torgersen 39.5 17.4 186 3800 female 2007 ## 3 Adelie Torgersen 40.3 18 195 3250 female 2007 ## 4 Adelie Torgersen NA NA NA NA <NA> 2007 ## 5 Adelie Torgersen 36.7 19.3 193 3450 female 2007 ## 6 Adelie Torgersen 39.3 20.6 190 3650 male 2007 ## 7 Adelie Torgersen 38.9 17.8 181 3625 female 2007 ## 8 Adelie Torgersen 39.2 19.6 195 4675 male 2007 ## 9 Adelie Torgersen 34.1 18.1 193 3475 <NA> 2007 ## 10 Adelie Torgersen 42 20.2 190 4250 <NA> 2007 ## # … with 334 more rows ``` ] --- count: false .panel1-show_data_palmer_flip-auto[ ```r penguins %>% group_by(species, sex, year, island) %>% * mutate(n = n()) ``` ] .panel2-show_data_palmer_flip-auto[ ``` ## # A tibble: 344 × 9 ## # Groups: species, sex, year, island [35] ## species island bill_l bill_d flip_l bm sex year n ## <fct> <fct> <dbl> <dbl> <int> <int> <fct> <int> <int> ## 1 Adelie Torgersen 39.1 18.7 181 3750 male 2007 7 ## 2 Adelie Torgersen 39.5 17.4 186 3800 female 2007 8 ## 3 Adelie Torgersen 40.3 18 195 3250 female 2007 8 ## 4 Adelie Torgersen NA NA NA NA <NA> 2007 5 ## 5 Adelie Torgersen 36.7 19.3 193 3450 female 2007 8 ## 6 Adelie Torgersen 39.3 20.6 190 3650 male 2007 7 ## 7 Adelie Torgersen 38.9 17.8 181 3625 female 2007 8 ## 8 Adelie Torgersen 39.2 19.6 195 4675 male 2007 7 ## 9 Adelie Torgersen 34.1 18.1 193 3475 <NA> 2007 5 ## 10 Adelie Torgersen 42 20.2 190 4250 <NA> 2007 5 ## # … with 334 more rows ``` ] --- count: false .panel1-show_data_palmer_flip-auto[ ```r penguins %>% group_by(species, sex, year, island) %>% mutate(n = n()) %>% * summarise_if(is.numeric, mean, na.rm = TRUE) ``` ] .panel2-show_data_palmer_flip-auto[ ``` ## # A tibble: 35 × 9 ## # Groups: species, sex, year [22] ## species sex year island bill_l bill_d flip_l bm n ## <fct> <fct> <int> <fct> <dbl> <dbl> <dbl> <dbl> <dbl> ## 1 Adelie female 2007 Biscoe 37.5 18.6 182. 3470 5 ## 2 Adelie female 2007 Dream 37.9 17.8 185 3269. 9 ## 3 Adelie female 2007 Torgersen 38.3 18.2 188. 3475 8 ## 4 Adelie female 2008 Biscoe 36.6 17.2 187. 3244. 9 ## 5 Adelie female 2008 Dream 36.3 17.8 189 3412. 8 ## 6 Adelie female 2008 Torgersen 36.6 17.4 190 3519. 8 ## 7 Adelie female 2009 Biscoe 38.1 17.7 191. 3447. 8 ## 8 Adelie female 2009 Dream 36.6 17.3 190. 3358. 10 ## 9 Adelie female 2009 Torgersen 37.8 17.1 187. 3194. 8 ## 10 Adelie male 2007 Biscoe 39.2 18.3 182. 3770 5 ## # … with 25 more rows ``` ] --- count: false .panel1-show_data_palmer_flip-auto[ ```r penguins %>% group_by(species, sex, year, island) %>% mutate(n = n()) %>% summarise_if(is.numeric, mean, na.rm = TRUE) %>% * print(n=10) ``` ] .panel2-show_data_palmer_flip-auto[ ``` ## # A tibble: 35 × 9 ## # Groups: species, sex, year [22] ## species sex year island bill_l bill_d flip_l bm n ## <fct> <fct> <int> <fct> <dbl> <dbl> <dbl> <dbl> <dbl> ## 1 Adelie female 2007 Biscoe 37.5 18.6 182. 3470 5 ## 2 Adelie female 2007 Dream 37.9 17.8 185 3269. 9 ## 3 Adelie female 2007 Torgersen 38.3 18.2 188. 3475 8 ## 4 Adelie female 2008 Biscoe 36.6 17.2 187. 3244. 9 ## 5 Adelie female 2008 Dream 36.3 17.8 189 3412. 8 ## 6 Adelie female 2008 Torgersen 36.6 17.4 190 3519. 8 ## 7 Adelie female 2009 Biscoe 38.1 17.7 191. 3447. 8 ## 8 Adelie female 2009 Dream 36.6 17.3 190. 3358. 10 ## 9 Adelie female 2009 Torgersen 37.8 17.1 187. 3194. 8 ## 10 Adelie male 2007 Biscoe 39.2 18.3 182. 3770 5 ## # … with 25 more rows ``` ] <style> .panel1-show_data_palmer_flip-auto { color: black; width: 38.6060606060606%; hight: 32%; float: left; padding-left: 1%; font-size: 80% } .panel2-show_data_palmer_flip-auto { color: black; width: 59.3939393939394%; hight: 32%; float: left; padding-left: 1%; font-size: 80% } .panel3-show_data_palmer_flip-auto { color: black; width: NA%; hight: 33%; float: left; padding-left: 1%; font-size: 80% } </style> --- template: manip class: inverse .center[.highlight[Your turn!]] --- template: manip class: inverse ## Combining group_by, mutate and summarise - Your turn! 1. create a Diet_fact colum, where Diet is understood as a factor 2. count the number of species by Diet 3. Compute the average body weight per Diet, and per Diet x Clade 4. Compute the mean and standard deviation for Brain weight per Diet --- name: ggplot # Visualization thanks to ggplot --- template: ggplot gg stands for Grammar of Graphics and ggplot2 is *based on the Grammar of Graphics , that allows you to compose graphs by combining independent components* [Wic16]. *[The] grammar tells us that a graphic maps the* - *data* - *to the aesthetic attributes (colour, shape, size)* - *of geometric objects (points, lines, bars)*. - *The plot may also include statistical transformations of the data and information about the plot’s coordinate system*. - *Facetting can be used to plot for different subsets of the data.* *The combination of these independent components are what make up a graphic.* . --- # Simple plots --- name: scatter_slide # A scatter plot --- count: false .panel1-simple_scatter-auto[ ```r *penguins ``` ] .panel2-simple_scatter-auto[ ``` ## # A tibble: 344 × 8 ## species island bill_l bill_d flip_l bm sex year ## <fct> <fct> <dbl> <dbl> <int> <int> <fct> <int> ## 1 Adelie Torgersen 39.1 18.7 181 3750 male 2007 ## 2 Adelie Torgersen 39.5 17.4 186 3800 female 2007 ## 3 Adelie Torgersen 40.3 18 195 3250 female 2007 ## 4 Adelie Torgersen NA NA NA NA <NA> 2007 ## 5 Adelie Torgersen 36.7 19.3 193 3450 female 2007 ## 6 Adelie Torgersen 39.3 20.6 190 3650 male 2007 ## 7 Adelie Torgersen 38.9 17.8 181 3625 female 2007 ## 8 Adelie Torgersen 39.2 19.6 195 4675 male 2007 ## 9 Adelie Torgersen 34.1 18.1 193 3475 <NA> 2007 ## 10 Adelie Torgersen 42 20.2 190 4250 <NA> 2007 ## # … with 334 more rows ``` ] --- count: false .panel1-simple_scatter-auto[ ```r penguins %>% * ggplot() ``` ] .panel2-simple_scatter-auto[ <!-- --> ] --- count: false .panel1-simple_scatter-auto[ ```r penguins %>% ggplot() + * aes( x= bill_l, y=bill_d) ``` ] .panel2-simple_scatter-auto[ <!-- --> ] --- count: false .panel1-simple_scatter-auto[ ```r penguins %>% ggplot() + aes( x= bill_l, y=bill_d) + * geom_point() ``` ] .panel2-simple_scatter-auto[ ``` ## Warning: Removed 2 rows containing missing values (geom_point). ``` 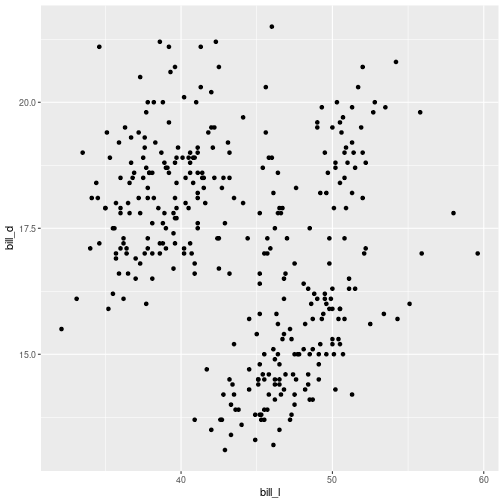<!-- --> ] <style> .panel1-simple_scatter-auto { color: black; width: 38.6060606060606%; hight: 32%; float: left; padding-left: 1%; font-size: 80% } .panel2-simple_scatter-auto { color: black; width: 59.3939393939394%; hight: 32%; float: left; padding-left: 1%; font-size: 80% } .panel3-simple_scatter-auto { color: black; width: NA%; hight: 33%; float: left; padding-left: 1%; font-size: 80% } </style> --- --- name: scatter_slide_col # A colored scatter plot --- count: false .panel1-scatter_plot_species-user[ ```r *penguins %>% * ggplot() + * aes( x= bill_l, y=bill_d) + * geom_point() ``` ] .panel2-scatter_plot_species-user[ ``` ## Warning: Removed 2 rows containing missing values (geom_point). ``` <!-- --> ] --- count: false .panel1-scatter_plot_species-user[ ```r penguins %>% ggplot() + aes( x= bill_l, y=bill_d) + geom_point() + * aes(col = species) ``` ] .panel2-scatter_plot_species-user[ ``` ## Warning: Removed 2 rows containing missing values (geom_point). ``` 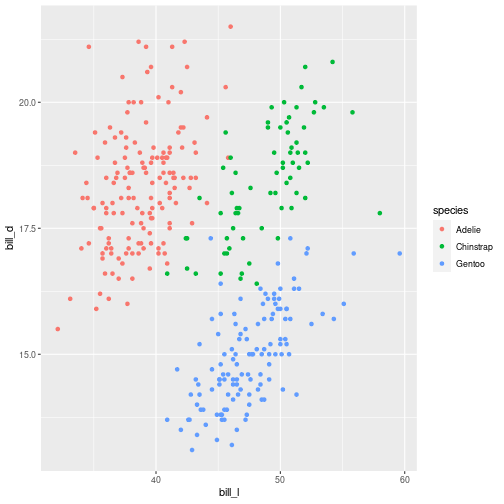<!-- --> ] <style> .panel1-scatter_plot_species-user { color: black; width: 38.6060606060606%; hight: 32%; float: left; padding-left: 1%; font-size: 80% } .panel2-scatter_plot_species-user { color: black; width: 59.3939393939394%; hight: 32%; float: left; padding-left: 1%; font-size: 80% } .panel3-scatter_plot_species-user { color: black; width: NA%; hight: 33%; float: left; padding-left: 1%; font-size: 80% } </style> --- template: scatter_slide_col count: false ```r gg <- penguins %>% ggplot() + aes( x= bill_l, y=bill_d) + geom_point() + aes(col = species) ``` ## with a color blind compliant palette --- count: false .panel1-scatter_viridis-auto[ ```r *gg ``` ] .panel2-scatter_viridis-auto[ ``` ## Warning: Removed 2 rows containing missing values (geom_point). ``` 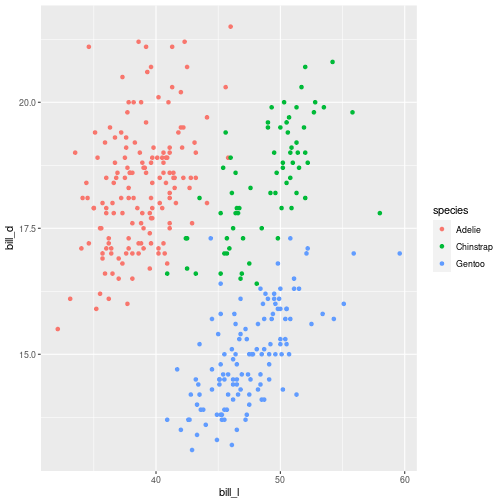<!-- --> ] --- count: false .panel1-scatter_viridis-auto[ ```r gg + * scale_color_viridis_d() ``` ] .panel2-scatter_viridis-auto[ ``` ## Warning: Removed 2 rows containing missing values (geom_point). ``` 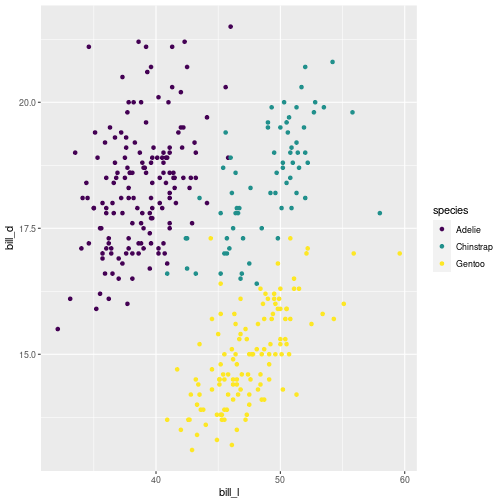<!-- --> ] <style> .panel1-scatter_viridis-auto { color: black; width: 38.6060606060606%; hight: 32%; float: left; padding-left: 1%; font-size: 80% } .panel2-scatter_viridis-auto { color: black; width: 59.3939393939394%; hight: 32%; float: left; padding-left: 1%; font-size: 80% } .panel3-scatter_viridis-auto { color: black; width: NA%; hight: 33%; float: left; padding-left: 1%; font-size: 80% } </style> --- template: scatter_slide_col count: false ## with a color tribute to [Wes Anderson](https://en.wikipedia.org/wiki/Wes_Anderson) Following a Tumblr blog [Wes Anderson Palettes](https://wesandersonpalettes.tumblr.com/), Karthik Ram proposes the [wesanderson palette](https://github.com/karthik/wesanderson) on Github. ```r ## remotes::install_github("wesanderson") color_darj <- wesanderson::wes_palette(name = "Darjeeling1") ``` --- count: false .panel1-scatter_wesanderson-auto[ ```r *gg ``` ] .panel2-scatter_wesanderson-auto[ ``` ## Warning: Removed 2 rows containing missing values (geom_point). ``` 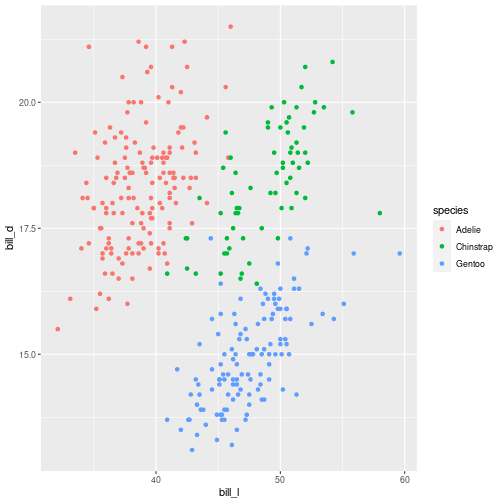<!-- --> ] --- count: false .panel1-scatter_wesanderson-auto[ ```r gg + * scale_color_manual(values = color_darj) ``` ] .panel2-scatter_wesanderson-auto[ ``` ## Warning: Removed 2 rows containing missing values (geom_point). ``` 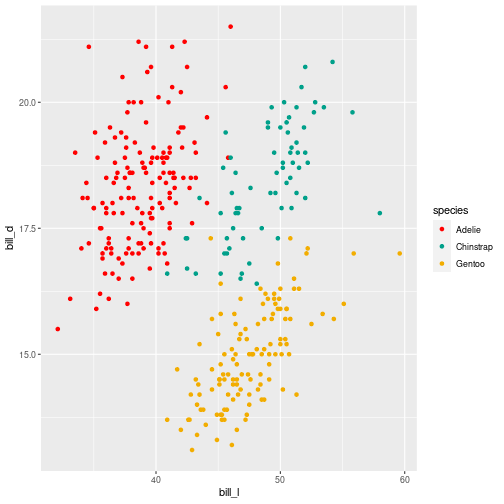<!-- --> ] <style> .panel1-scatter_wesanderson-auto { color: black; width: 38.6060606060606%; hight: 32%; float: left; padding-left: 1%; font-size: 80% } .panel2-scatter_wesanderson-auto { color: black; width: 59.3939393939394%; hight: 32%; float: left; padding-left: 1%; font-size: 80% } .panel3-scatter_wesanderson-auto { color: black; width: NA%; hight: 33%; float: left; padding-left: 1%; font-size: 80% } </style> --- template: scatter_slide_col class: inverse .center[.highlight[Your turn!]] --- class: inverse template: scatter_slide_col count: true ## Visualizing the relation between Body weight and Brain weight among bats species Propose a fancy graph to visualize the relation between Brain weight and Body weight. Does this relation differs between Diets ? --- template: scatter_slide_col count: true Propose a fancy graph to visualize the relation between flipper and body mass. Does this relation change over year ? ```r penguins %>% ggplot() + aes(x= bm, y = flip_l, col = as_factor(year) ) + geom_point() + scale_color_manual(values = wesanderson::wes_palette(name = "Zissou1")) ``` ``` ## Warning: Removed 2 rows containing missing values (geom_point). ``` 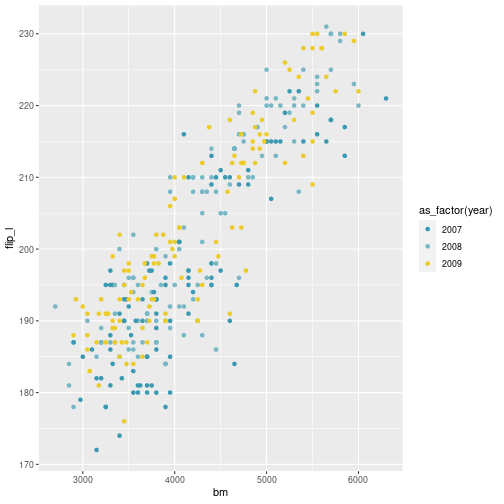<!-- --> --- template: scatter_slide_col ## Some nice color palette - [Inspired by Ghibli](https://github.com/ewenme/ghibli) - [The yarr pirate palette](https://cran.r-project.org/web/packages/yarrr/vignettes/piratepal.html) - [Harry Potter inspiration](https://github.com/aljrico/harrypotter) --- name: scatter_slide_lab count: true # Properly labeled colored graph --- template: scatter_slide_lab ```r gg <- gg + scale_color_manual(values = wesanderson::wes_palette(name = "Zissou1")) ``` --- count: false .panel1-scatter_labels-auto[ ```r *gg ``` ] .panel2-scatter_labels-auto[ ``` ## Warning: Removed 2 rows containing missing values (geom_point). ``` 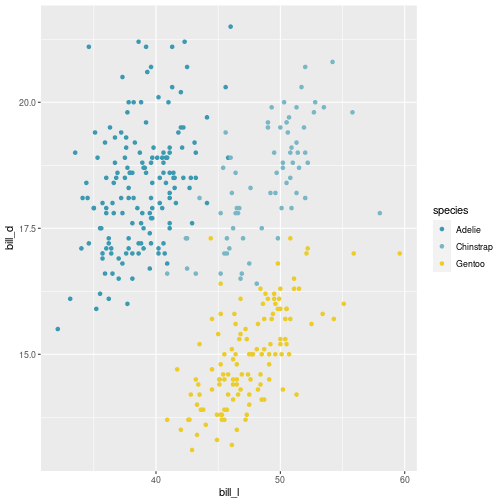<!-- --> ] --- count: false .panel1-scatter_labels-auto[ ```r gg + * labs( x = 'Bill length in mm') ``` ] .panel2-scatter_labels-auto[ ``` ## Warning: Removed 2 rows containing missing values (geom_point). ``` 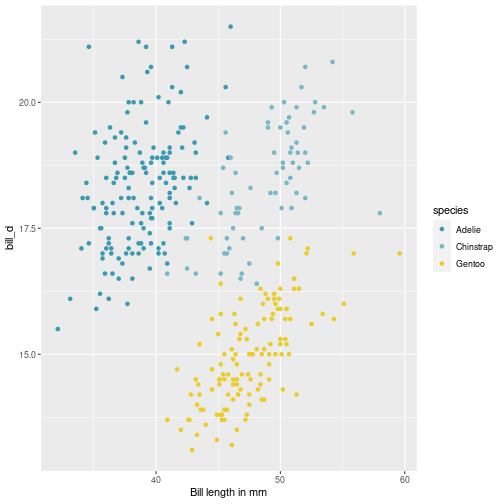<!-- --> ] --- count: false .panel1-scatter_labels-auto[ ```r gg + labs( x = 'Bill length in mm') + * labs(y = 'Bill depth in mm') ``` ] .panel2-scatter_labels-auto[ ``` ## Warning: Removed 2 rows containing missing values (geom_point). ``` 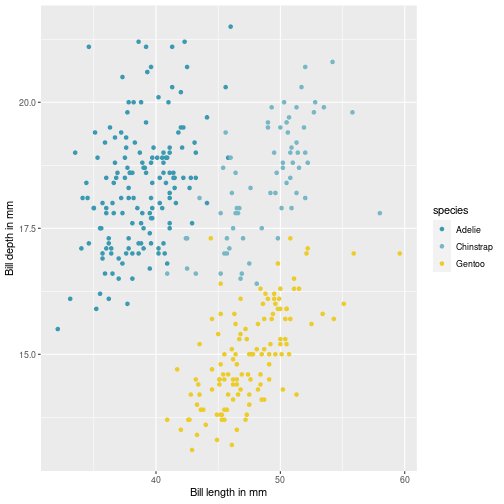<!-- --> ] --- count: false .panel1-scatter_labels-auto[ ```r gg + labs( x = 'Bill length in mm') + labs(y = 'Bill depth in mm') + * labs(color = "Species") ``` ] .panel2-scatter_labels-auto[ ``` ## Warning: Removed 2 rows containing missing values (geom_point). ``` 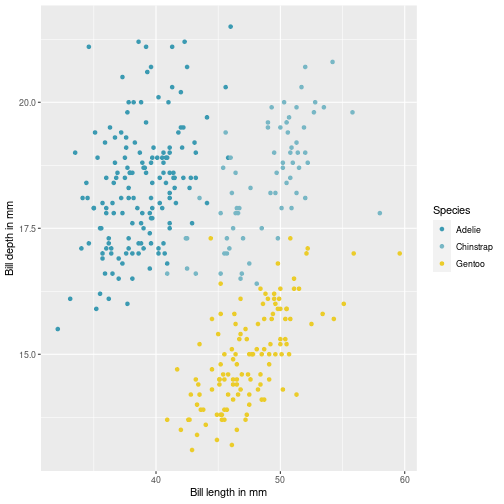<!-- --> ] <style> .panel1-scatter_labels-auto { color: black; width: 38.6060606060606%; hight: 32%; float: left; padding-left: 1%; font-size: 80% } .panel2-scatter_labels-auto { color: black; width: 59.3939393939394%; hight: 32%; float: left; padding-left: 1%; font-size: 80% } .panel3-scatter_labels-auto { color: black; width: NA%; hight: 33%; float: left; padding-left: 1%; font-size: 80% } </style> --- template: scatter_slide_lab count: true ## using a pre-set general theme --- count: false .panel1-scatter_themelight-user[ ```r *gg + * labs( x = 'Bill length in mm') + * labs(y = 'Bill depth in mm') + * labs(color = "Species") ``` ] .panel2-scatter_themelight-user[ ``` ## Warning: Removed 2 rows containing missing values (geom_point). ``` 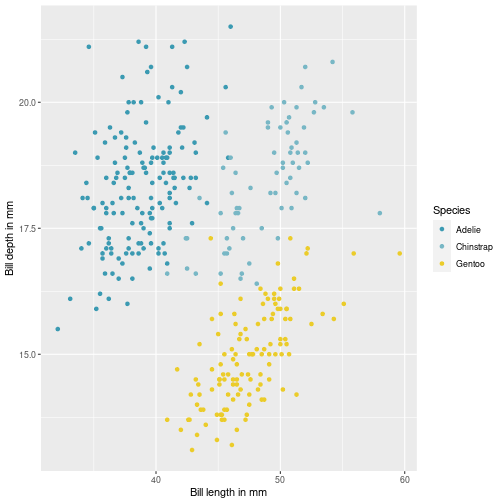<!-- --> ] --- count: false .panel1-scatter_themelight-user[ ```r gg + labs( x = 'Bill length in mm') + labs(y = 'Bill depth in mm') + labs(color = "Species") + * theme_light() ``` ] .panel2-scatter_themelight-user[ ``` ## Warning: Removed 2 rows containing missing values (geom_point). ``` 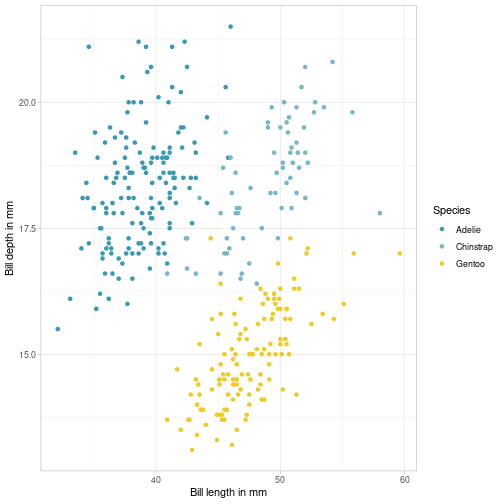<!-- --> ] <style> .panel1-scatter_themelight-user { color: black; width: 38.6060606060606%; hight: 32%; float: left; padding-left: 1%; font-size: 80% } .panel2-scatter_themelight-user { color: black; width: 59.3939393939394%; hight: 32%; float: left; padding-left: 1%; font-size: 80% } .panel3-scatter_themelight-user { color: black; width: NA%; hight: 33%; float: left; padding-left: 1%; font-size: 80% } </style> --- template: scatter_slide_lab count: false ## and another pre set general theme --- ```r gg + labs( x = 'Bill length in mm', y = 'Bill depth in mm', color = "Species") + theme_light() + theme_minimal() ``` ``` ## Warning: Removed 2 rows containing missing values (geom_point). ``` 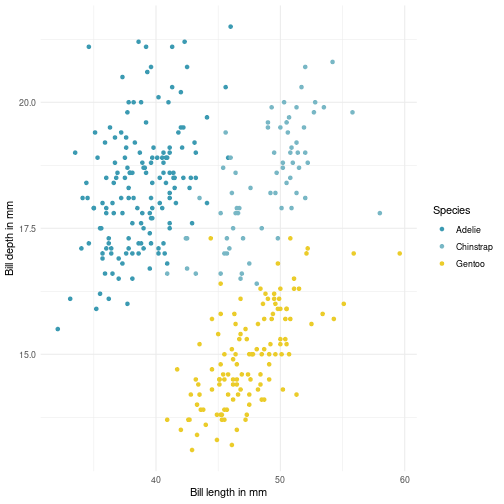<!-- --> --- count: false .panel1-scatter_thememinimal-user[ ```r *gg + * labs( x = 'Bill length in mm', * y = 'Bill depth in mm', color = "Species") + * theme_light() ``` ] .panel2-scatter_thememinimal-user[ ``` ## Warning: Removed 2 rows containing missing values (geom_point). ``` 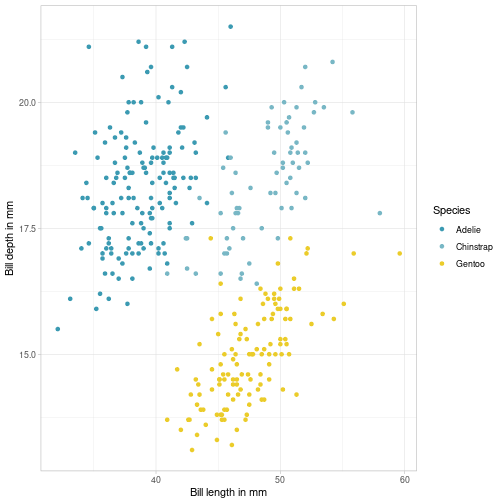<!-- --> ] --- count: false .panel1-scatter_thememinimal-user[ ```r gg + labs( x = 'Bill length in mm', y = 'Bill depth in mm', color = "Species") + theme_light() + * theme_minimal() ``` ] .panel2-scatter_thememinimal-user[ ``` ## Warning: Removed 2 rows containing missing values (geom_point). ``` 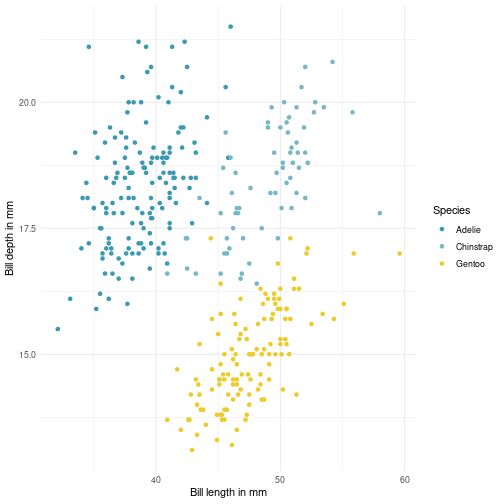<!-- --> ] <style> .panel1-scatter_thememinimal-user { color: black; width: 38.6060606060606%; hight: 32%; float: left; padding-left: 1%; font-size: 80% } .panel2-scatter_thememinimal-user { color: black; width: 59.3939393939394%; hight: 32%; float: left; padding-left: 1%; font-size: 80% } .panel3-scatter_thememinimal-user { color: black; width: NA%; hight: 33%; float: left; padding-left: 1%; font-size: 80% } </style> --- template: scatter_slide_lab count: false ## and a pre set general theme ```r gg <- gg + labs( x = 'Bill length in mm', y = 'Bill depth in mm', color = "Species") + theme_light() ``` --- template: scatter_slide_lab count: true ## Defining s specific theme The default theme might not be the best option ``` ## Warning: Removed 2 rows containing missing values (geom_point). ``` 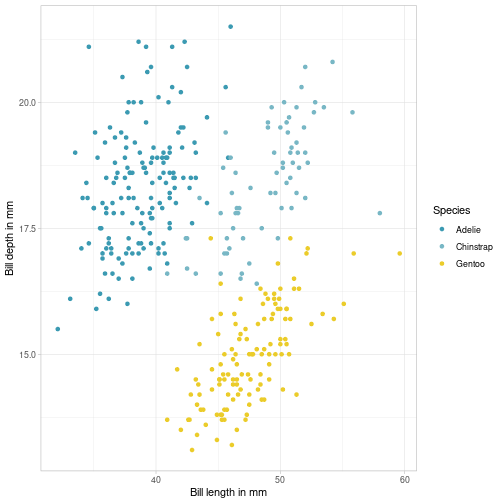<!-- --> --- count: false .panel1-scatter_below-auto[ ```r *gg ``` ] .panel2-scatter_below-auto[ ``` ## Warning: Removed 2 rows containing missing values (geom_point). ``` 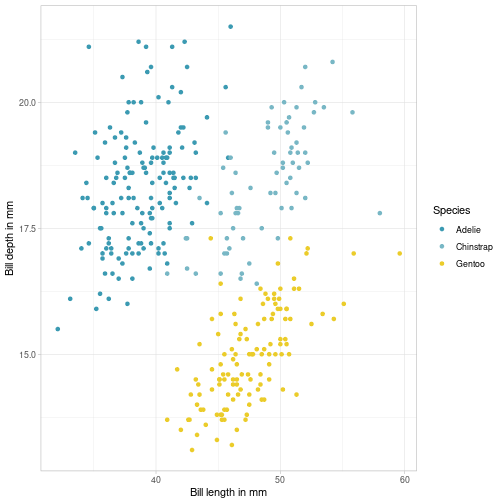<!-- --> ] --- count: false .panel1-scatter_below-auto[ ```r gg + * theme(legend.position="bottom") ``` ] .panel2-scatter_below-auto[ ``` ## Warning: Removed 2 rows containing missing values (geom_point). ``` 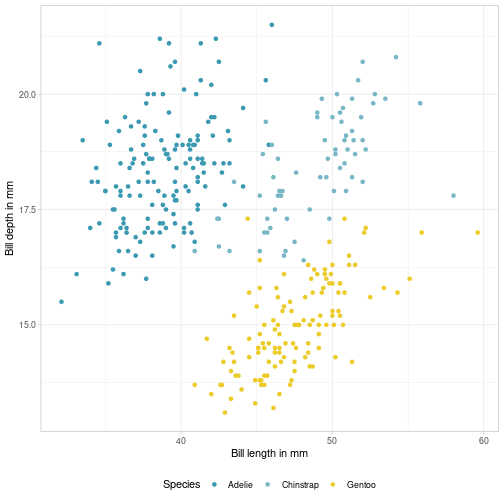<!-- --> ] <style> .panel1-scatter_below-auto { color: black; width: 38.6060606060606%; hight: 32%; float: left; padding-left: 1%; font-size: 80% } .panel2-scatter_below-auto { color: black; width: 59.3939393939394%; hight: 32%; float: left; padding-left: 1%; font-size: 80% } .panel3-scatter_below-auto { color: black; width: NA%; hight: 33%; float: left; padding-left: 1%; font-size: 80% } </style> --- template: scatter_slide_lab count: false ## and a custom theme The legend position can also be specified by a vector ` c(x,y)`. Their values should be between 0 and 1. c(0,0) corresponds to the “bottom left” and c(1,1) corresponds to the “top right” position. We may want to change the size. ```r gg + theme(legend.position=c(.9, .6)) ``` ``` ## Warning: Removed 2 rows containing missing values (geom_point). ``` 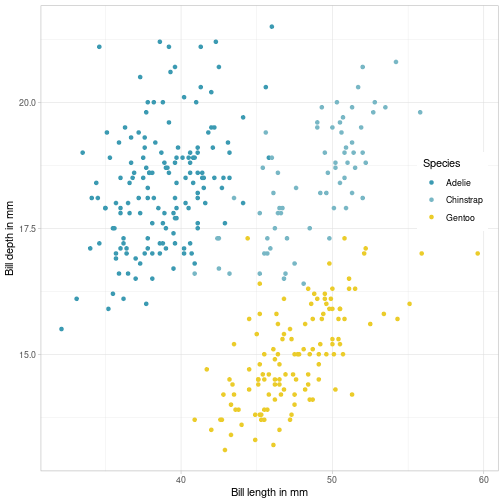<!-- --> --- template: scatter_slide_lab count: false ## and a custom theme ```r gg + theme(legend.position=c(.9, .6), text = element_text(size = 10, face = "italic"), axis.text.x = element_text(angle=90, hjust=1), legend.text = element_text(size = 9, face = 'plain'), legend.title = element_text(size = 11, face = "bold") ) ``` ``` ## Warning: Removed 2 rows containing missing values (geom_point). ``` 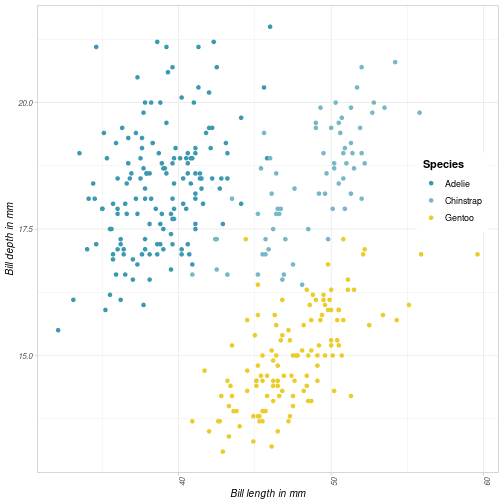<!-- --> --- name: sum_info # Summarizing information for easier reading --- template: sum_info count: true ## with fitted statistical models --- count: false .panel1-stat_info_lm-auto[ ```r *gg ``` ] .panel2-stat_info_lm-auto[ ``` ## Warning: Removed 2 rows containing missing values (geom_point). ``` 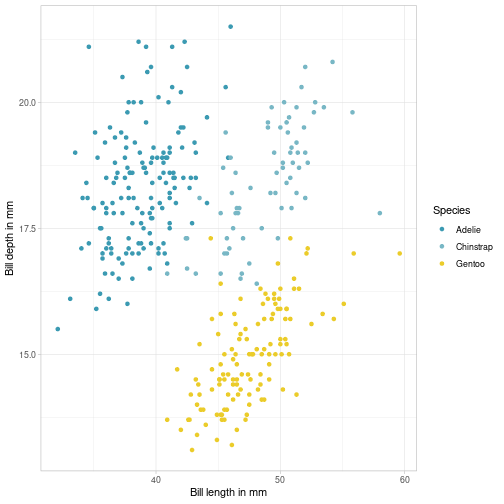<!-- --> ] --- count: false .panel1-stat_info_lm-auto[ ```r gg + * geom_smooth(method = 'lm', se = FALSE) ``` ] .panel2-stat_info_lm-auto[ ``` ## `geom_smooth()` using formula 'y ~ x' ``` ``` ## Warning: Removed 2 rows containing non-finite values (stat_smooth). ``` ``` ## Warning: Removed 2 rows containing missing values (geom_point). ``` 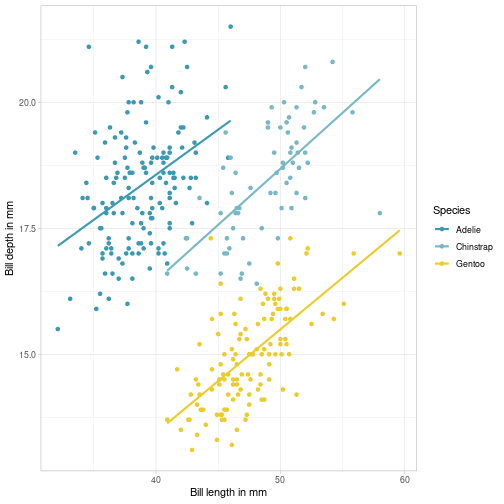<!-- --> ] --- count: false .panel1-stat_info_lm-auto[ ```r gg + geom_smooth(method = 'lm', se = FALSE) + * geom_smooth(method = 'loess', se = TRUE) ``` ] .panel2-stat_info_lm-auto[ ``` ## `geom_smooth()` using formula 'y ~ x' ``` ``` ## Warning: Removed 2 rows containing non-finite values (stat_smooth). ``` ``` ## `geom_smooth()` using formula 'y ~ x' ``` ``` ## Warning: Removed 2 rows containing non-finite values (stat_smooth). ``` ``` ## Warning: Removed 2 rows containing missing values (geom_point). ``` 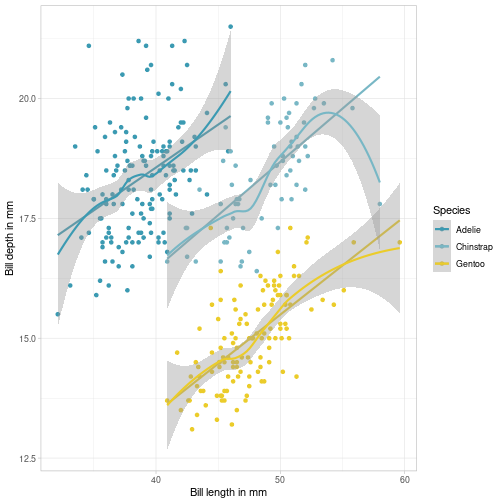<!-- --> ] <style> .panel1-stat_info_lm-auto { color: black; width: 38.6060606060606%; hight: 32%; float: left; padding-left: 1%; font-size: 80% } .panel2-stat_info_lm-auto { color: black; width: 59.3939393939394%; hight: 32%; float: left; padding-left: 1%; font-size: 80% } .panel3-stat_info_lm-auto { color: black; width: NA%; hight: 33%; float: left; padding-left: 1%; font-size: 80% } </style> --- template: scatter_slide_col class: inverse .center[.highlight[Your turn!]] --- class: inverse template: scatter_slide_lab count: true ## Visualizing the relation between Body weight and Brain weight among bats species Propose a fancy graph to visualize the relation between Brain weight and Body weight. Does this relation differs between Diets ? --- template: scatter_slide_lab count: true Propose a fancy graph to visualize the relation between flipper and body mass. Does this relation change over year ? -- ```r penguins %>% ggplot() + aes(x= bm, y = flip_l, col = as_factor(year) ) + geom_point() + geom_smooth(method = 'lm') + scale_color_manual(values = wesanderson::wes_palette(name = "Darjeeling1")) + labs( x = 'Bill length in mm', y = 'Bill depth in mm', color = "Species") ``` ``` ## `geom_smooth()` using formula 'y ~ x' ``` ``` ## Warning: Removed 2 rows containing non-finite values (stat_smooth). ``` ``` ## Warning: Removed 2 rows containing missing values (geom_point). ``` 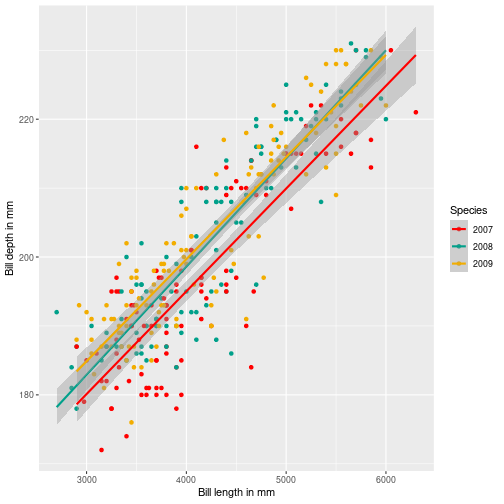<!-- --> --- template: scatter_slide_lab To keep the theme preferences for all plots to come --- count: false .panel1-theme_setup-user[ ```r *penguins %>% * ggplot() + * aes( x= bill_l, y=bill_d, col = species) + * geom_point() ``` ] .panel2-theme_setup-user[ ``` ## Warning: Removed 2 rows containing missing values (geom_point). ``` 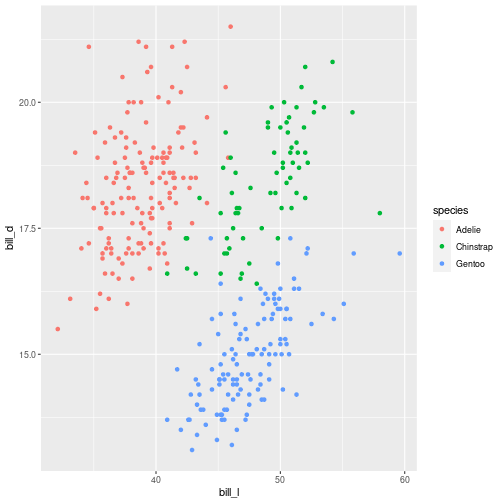<!-- --> ] --- count: false .panel1-theme_setup-user[ ```r penguins %>% ggplot() + aes( x= bill_l, y=bill_d, col = species) + geom_point() ``` ] .panel2-theme_setup-user[ ``` ## Warning: Removed 2 rows containing missing values (geom_point). ``` 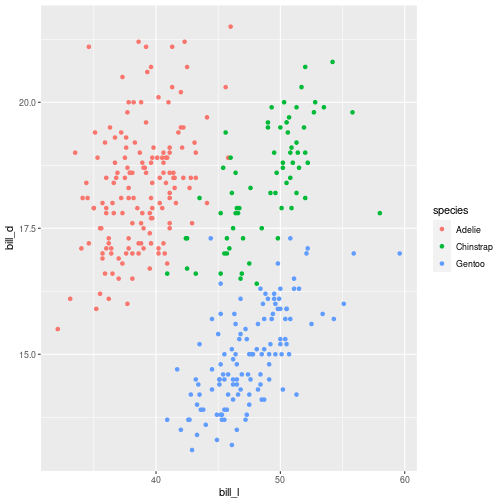<!-- --> ] <style> .panel1-theme_setup-user { color: black; width: 38.6060606060606%; hight: 32%; float: left; padding-left: 1%; font-size: 80% } .panel2-theme_setup-user { color: black; width: 59.3939393939394%; hight: 32%; float: left; padding-left: 1%; font-size: 80% } .panel3-theme_setup-user { color: black; width: NA%; hight: 33%; float: left; padding-left: 1%; font-size: 80% } </style> --- count: false .panel1-theme_setup_2-user[ ```r *theme_set(theme_light()) *theme_update(legend.position="bottom") ``` ] .panel2-theme_setup_2-user[ ] --- count: false .panel1-theme_setup_2-user[ ```r theme_set(theme_light()) theme_update(legend.position="bottom") *penguins %>% * ggplot() + * aes( x= bill_l, y=bill_d, col = species) + * geom_point() ``` ] .panel2-theme_setup_2-user[ ``` ## Warning: Removed 2 rows containing missing values (geom_point). ``` 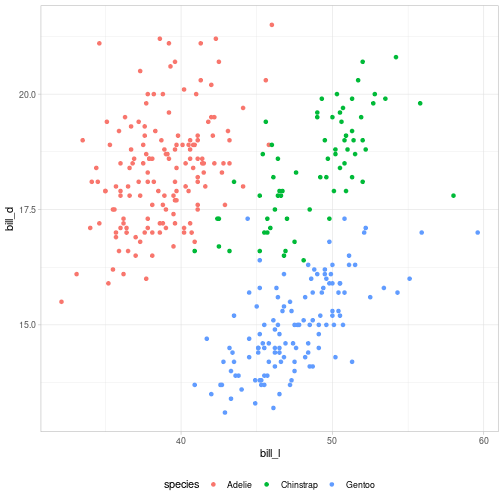<!-- --> ] <style> .panel1-theme_setup_2-user { color: black; width: 38.6060606060606%; hight: 32%; float: left; padding-left: 1%; font-size: 80% } .panel2-theme_setup_2-user { color: black; width: 59.3939393939394%; hight: 32%; float: left; padding-left: 1%; font-size: 80% } .panel3-theme_setup_2-user { color: black; width: NA%; hight: 33%; float: left; padding-left: 1%; font-size: 80% } </style> --- name: plot_univar # Representing univariate distribution --- template: plot_univar count: false ```r penguins %>% ggplot() + aes(x = bill_l) + geom_histogram() + labs( x = 'Bill length in mm') + theme_minimal() ``` ``` ## `stat_bin()` using `bins = 30`. Pick better value with `binwidth`. ``` ``` ## Warning: Removed 2 rows containing non-finite values (stat_bin). ``` 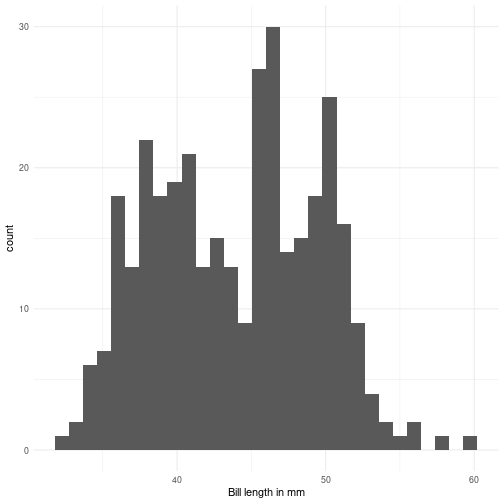<!-- --> --- template: plot_univar class: inverse .center[.highlight[Your turn!]] --- template: plot_univar class: inverse Represent the distribution of body weight according to diet among bats species. --- template: plot_univar Represent the distribution of bill length according to species. --- count: false .panel1-color_hist_cor-auto[ ```r *penguins ``` ] .panel2-color_hist_cor-auto[ ``` ## # A tibble: 344 × 8 ## species island bill_l bill_d flip_l bm sex year ## <fct> <fct> <dbl> <dbl> <int> <int> <fct> <int> ## 1 Adelie Torgersen 39.1 18.7 181 3750 male 2007 ## 2 Adelie Torgersen 39.5 17.4 186 3800 female 2007 ## 3 Adelie Torgersen 40.3 18 195 3250 female 2007 ## 4 Adelie Torgersen NA NA NA NA <NA> 2007 ## 5 Adelie Torgersen 36.7 19.3 193 3450 female 2007 ## 6 Adelie Torgersen 39.3 20.6 190 3650 male 2007 ## 7 Adelie Torgersen 38.9 17.8 181 3625 female 2007 ## 8 Adelie Torgersen 39.2 19.6 195 4675 male 2007 ## 9 Adelie Torgersen 34.1 18.1 193 3475 <NA> 2007 ## 10 Adelie Torgersen 42 20.2 190 4250 <NA> 2007 ## # … with 334 more rows ``` ] --- count: false .panel1-color_hist_cor-auto[ ```r penguins %>% * ggplot() + aes(x = bill_l, fill = species) ``` ] .panel2-color_hist_cor-auto[ <!-- --> ] --- count: false .panel1-color_hist_cor-auto[ ```r penguins %>% ggplot() + aes(x = bill_l, fill = species) + * geom_histogram( position = "identity", alpha = 0.5) ``` ] .panel2-color_hist_cor-auto[ ``` ## `stat_bin()` using `bins = 30`. Pick better value with `binwidth`. ``` ``` ## Warning: Removed 2 rows containing non-finite values (stat_bin). ``` <!-- --> ] --- count: false .panel1-color_hist_cor-auto[ ```r penguins %>% ggplot() + aes(x = bill_l, fill = species) + geom_histogram( position = "identity", alpha = 0.5) + * labs( x = 'Bill length in mm') ``` ] .panel2-color_hist_cor-auto[ ``` ## `stat_bin()` using `bins = 30`. Pick better value with `binwidth`. ``` ``` ## Warning: Removed 2 rows containing non-finite values (stat_bin). ``` <!-- --> ] --- count: false .panel1-color_hist_cor-auto[ ```r penguins %>% ggplot() + aes(x = bill_l, fill = species) + geom_histogram( position = "identity", alpha = 0.5) + labs( x = 'Bill length in mm') + * scale_fill_manual(values = wesanderson::wes_palette('Zissou1', n = 3)) ``` ] .panel2-color_hist_cor-auto[ ``` ## `stat_bin()` using `bins = 30`. Pick better value with `binwidth`. ``` ``` ## Warning: Removed 2 rows containing non-finite values (stat_bin). ``` <!-- --> ] <style> .panel1-color_hist_cor-auto { color: black; width: 38.6060606060606%; hight: 32%; float: left; padding-left: 1%; font-size: 80% } .panel2-color_hist_cor-auto { color: black; width: 59.3939393939394%; hight: 32%; float: left; padding-left: 1%; font-size: 80% } .panel3-color_hist_cor-auto { color: black; width: NA%; hight: 33%; float: left; padding-left: 1%; font-size: 80% } </style> --- template: plot_univar Represent the distribution of bill length according to species. ``` ## `stat_bin()` using `bins = 30`. Pick better value with `binwidth`. ``` ``` ## Warning: Removed 2 rows containing non-finite values (stat_bin). ``` <!-- --> .care[Note the use of the position and alpha parameters.] --- name: compare_plot # Comparing plots : facetting --- count: false .panel1-color_hist_facet-auto[ ```r *penguins ``` ] .panel2-color_hist_facet-auto[ ``` ## # A tibble: 344 × 8 ## species island bill_l bill_d flip_l bm sex year ## <fct> <fct> <dbl> <dbl> <int> <int> <fct> <int> ## 1 Adelie Torgersen 39.1 18.7 181 3750 male 2007 ## 2 Adelie Torgersen 39.5 17.4 186 3800 female 2007 ## 3 Adelie Torgersen 40.3 18 195 3250 female 2007 ## 4 Adelie Torgersen NA NA NA NA <NA> 2007 ## 5 Adelie Torgersen 36.7 19.3 193 3450 female 2007 ## 6 Adelie Torgersen 39.3 20.6 190 3650 male 2007 ## 7 Adelie Torgersen 38.9 17.8 181 3625 female 2007 ## 8 Adelie Torgersen 39.2 19.6 195 4675 male 2007 ## 9 Adelie Torgersen 34.1 18.1 193 3475 <NA> 2007 ## 10 Adelie Torgersen 42 20.2 190 4250 <NA> 2007 ## # … with 334 more rows ``` ] --- count: false .panel1-color_hist_facet-auto[ ```r penguins %>% * ggplot() + aes(x = bill_l, fill = species) ``` ] .panel2-color_hist_facet-auto[ <!-- --> ] --- count: false .panel1-color_hist_facet-auto[ ```r penguins %>% ggplot() + aes(x = bill_l, fill = species) + * geom_histogram() ``` ] .panel2-color_hist_facet-auto[ ``` ## `stat_bin()` using `bins = 30`. Pick better value with `binwidth`. ``` ``` ## Warning: Removed 2 rows containing non-finite values (stat_bin). ``` <!-- --> ] --- count: false .panel1-color_hist_facet-auto[ ```r penguins %>% ggplot() + aes(x = bill_l, fill = species) + geom_histogram() + * facet_wrap(~species) ``` ] .panel2-color_hist_facet-auto[ ``` ## `stat_bin()` using `bins = 30`. Pick better value with `binwidth`. ``` ``` ## Warning: Removed 2 rows containing non-finite values (stat_bin). ``` <!-- --> ] --- count: false .panel1-color_hist_facet-auto[ ```r penguins %>% ggplot() + aes(x = bill_l, fill = species) + geom_histogram() + facet_wrap(~species) + * labs( x = 'Bill length in mm') ``` ] .panel2-color_hist_facet-auto[ ``` ## `stat_bin()` using `bins = 30`. Pick better value with `binwidth`. ``` ``` ## Warning: Removed 2 rows containing non-finite values (stat_bin). ``` <!-- --> ] --- count: false .panel1-color_hist_facet-auto[ ```r penguins %>% ggplot() + aes(x = bill_l, fill = species) + geom_histogram() + facet_wrap(~species) + labs( x = 'Bill length in mm') + * scale_fill_manual(values = wesanderson::wes_palette('Darjeeling1')) ``` ] .panel2-color_hist_facet-auto[ ``` ## `stat_bin()` using `bins = 30`. Pick better value with `binwidth`. ``` ``` ## Warning: Removed 2 rows containing non-finite values (stat_bin). ``` <!-- --> ] <style> .panel1-color_hist_facet-auto { color: black; width: 38.6060606060606%; hight: 32%; float: left; padding-left: 1%; font-size: 80% } .panel2-color_hist_facet-auto { color: black; width: 59.3939393939394%; hight: 32%; float: left; padding-left: 1%; font-size: 80% } .panel3-color_hist_facet-auto { color: black; width: NA%; hight: 33%; float: left; padding-left: 1%; font-size: 80% } </style> --- template: compare_plot ``` ## `stat_bin()` using `bins = 30`. Pick better value with `binwidth`. ``` ``` ## Warning: Removed 2 rows containing non-finite values (stat_bin). ``` <!-- --> --- template: compare_plot count: false class: inverse .center[.highlight[Your turn!]] --- template: compare_plot count: false Change the previous graph to add a fitted density line --- count: false .panel1-color_hist_dens_cor-user[ ```r *penguins %>% ggplot() + aes(x = bill_l, y = ..density..) + * facet_wrap(~species) + * geom_histogram(alpha=0.5, aes( fill = species)) + * geom_density(aes(col = species)) + * labs( x = 'Bill length in mm') ``` ] .panel2-color_hist_dens_cor-user[ ``` ## `stat_bin()` using `bins = 30`. Pick better value with `binwidth`. ``` ``` ## Warning: Removed 2 rows containing non-finite values (stat_bin). ``` ``` ## Warning: Removed 2 rows containing non-finite values (stat_density). ``` <!-- --> ] --- count: false .panel1-color_hist_dens_cor-user[ ```r penguins %>% ggplot() + aes(x = bill_l, y = ..density..) + facet_wrap(~species) + geom_histogram(alpha=0.5, aes( fill = species)) + geom_density(aes(col = species)) + labs( x = 'Bill length in mm') + * scale_fill_manual(values = wesanderson::wes_palette('Darjeeling1')) ``` ] .panel2-color_hist_dens_cor-user[ ``` ## `stat_bin()` using `bins = 30`. Pick better value with `binwidth`. ``` ``` ## Warning: Removed 2 rows containing non-finite values (stat_bin). ``` ``` ## Warning: Removed 2 rows containing non-finite values (stat_density). ``` <!-- --> ] --- count: false .panel1-color_hist_dens_cor-user[ ```r penguins %>% ggplot() + aes(x = bill_l, y = ..density..) + facet_wrap(~species) + geom_histogram(alpha=0.5, aes( fill = species)) + geom_density(aes(col = species)) + labs( x = 'Bill length in mm') + scale_fill_manual(values = wesanderson::wes_palette('Darjeeling1')) + * scale_color_manual(values = wesanderson::wes_palette('Darjeeling1')) ``` ] .panel2-color_hist_dens_cor-user[ ``` ## `stat_bin()` using `bins = 30`. Pick better value with `binwidth`. ``` ``` ## Warning: Removed 2 rows containing non-finite values (stat_bin). ``` ``` ## Warning: Removed 2 rows containing non-finite values (stat_density). ``` <!-- --> ] <style> .panel1-color_hist_dens_cor-user { color: black; width: 38.6060606060606%; hight: 32%; float: left; padding-left: 1%; font-size: 80% } .panel2-color_hist_dens_cor-user { color: black; width: 59.3939393939394%; hight: 32%; float: left; padding-left: 1%; font-size: 80% } .panel3-color_hist_dens_cor-user { color: black; width: NA%; hight: 33%; float: left; padding-left: 1%; font-size: 80% } </style> --- name: boxplot # Comparing distribution --- template: boxplot count: false ```r penguins %>% ggplot() + aes(x = species, y = bill_l) + geom_boxplot(alpha=0.5, aes( fill = species)) + labs( y = 'Bill length in mm') + #BREAK scale_fill_manual(values = wesanderson::wes_palette('Darjeeling1')) + #BREAK scale_color_manual(values = wesanderson::wes_palette('Darjeeling1')) ``` ``` ## Warning: Removed 2 rows containing non-finite values (stat_boxplot). ``` 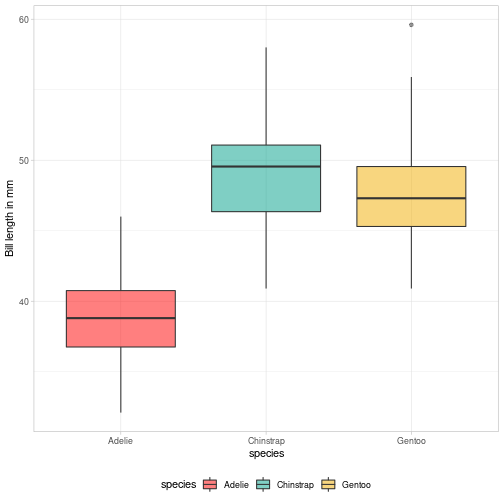<!-- --> --- count: false .panel1-color_boxplot_2-user[ ```r *penguins %>% ggplot() + aes(x = species, y = bill_l) + * geom_violin(alpha=0.5, aes( fill = species)) + * labs( y = 'Bill length in mm') ``` ] .panel2-color_boxplot_2-user[ ``` ## Warning: Removed 2 rows containing non-finite values (stat_ydensity). ``` <!-- --> ] --- count: false .panel1-color_boxplot_2-user[ ```r penguins %>% ggplot() + aes(x = species, y = bill_l) + geom_violin(alpha=0.5, aes( fill = species)) + labs( y = 'Bill length in mm') + * scale_fill_manual(values = wesanderson::wes_palette('Darjeeling1')) ``` ] .panel2-color_boxplot_2-user[ ``` ## Warning: Removed 2 rows containing non-finite values (stat_ydensity). ``` <!-- --> ] <style> .panel1-color_boxplot_2-user { color: black; width: 38.6060606060606%; hight: 32%; float: left; padding-left: 1%; font-size: 80% } .panel2-color_boxplot_2-user { color: black; width: 59.3939393939394%; hight: 32%; float: left; padding-left: 1%; font-size: 80% } .panel3-color_boxplot_2-user { color: black; width: NA%; hight: 33%; float: left; padding-left: 1%; font-size: 80% } </style> --- count: false .panel1-color_boxplot_3-user[ ```r *penguins %>% ggplot() + aes(x = species, y = bill_l) + * geom_boxplot(alpha=0.5, aes( fill = species)) + * geom_jitter(color="black", size=0.4, alpha=0.8) + * labs( y = 'Bill length in mm') ``` ] .panel2-color_boxplot_3-user[ ``` ## Warning: Removed 2 rows containing non-finite values (stat_boxplot). ``` ``` ## Warning: Removed 2 rows containing missing values (geom_point). ``` <!-- --> ] --- count: false .panel1-color_boxplot_3-user[ ```r penguins %>% ggplot() + aes(x = species, y = bill_l) + geom_boxplot(alpha=0.5, aes( fill = species)) + geom_jitter(color="black", size=0.4, alpha=0.8) + labs( y = 'Bill length in mm') + * scale_fill_manual(values = wesanderson::wes_palette('Darjeeling1')) ``` ] .panel2-color_boxplot_3-user[ ``` ## Warning: Removed 2 rows containing non-finite values (stat_boxplot). ``` ``` ## Warning: Removed 2 rows containing missing values (geom_point). ``` <!-- --> ] <style> .panel1-color_boxplot_3-user { color: black; width: 38.6060606060606%; hight: 32%; float: left; padding-left: 1%; font-size: 80% } .panel2-color_boxplot_3-user { color: black; width: 59.3939393939394%; hight: 32%; float: left; padding-left: 1%; font-size: 80% } .panel3-color_boxplot_3-user { color: black; width: NA%; hight: 33%; float: left; padding-left: 1%; font-size: 80% } </style> --- name: annotating # Precise labelling --- template: annotating count: false ## Handling superscript and subscript ```r penguins %>% mutate(mu = bill_l * bill_d) %>% ggplot() + aes(y= mu ) + geom_boxplot(alpha=0.5, aes( fill = species)) + labs( y = bquote(mu~(mm^2))) + scale_fill_manual(values = wesanderson::wes_palette('Darjeeling1')) ``` ``` ## Warning: Removed 2 rows containing non-finite values (stat_boxplot). ``` <!-- --> --- name: useful_package # Useful packages for publication The `ggpubr` package is very helpful for publication. --- template: useful_package count: false ```r gg_p1 <- gg gg_p1 ``` ``` ## Warning: Removed 2 rows containing missing values (geom_point). ``` 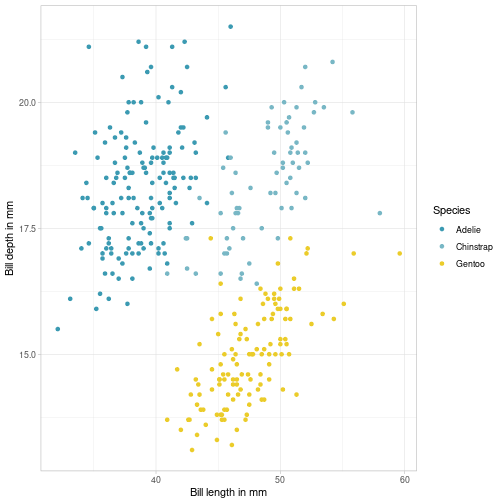<!-- --> --- template: useful_package count: false ```r gg_p2 <- penguins %>% ggplot() + aes(x = bill_l, y = ..density..) + geom_histogram(alpha=0.5, position = "identity", aes( fill = species)) + geom_density(aes(col = species)) + labs( x = 'Bill length in mm') + scale_fill_manual(values = wesanderson::wes_palette('Zissou1')) + scale_color_manual(values = wesanderson::wes_palette('Zissou1')) gg_p2 ``` ``` ## `stat_bin()` using `bins = 30`. Pick better value with `binwidth`. ``` ``` ## Warning: Removed 2 rows containing non-finite values (stat_bin). ``` ``` ## Warning: Removed 2 rows containing non-finite values (stat_density). ``` 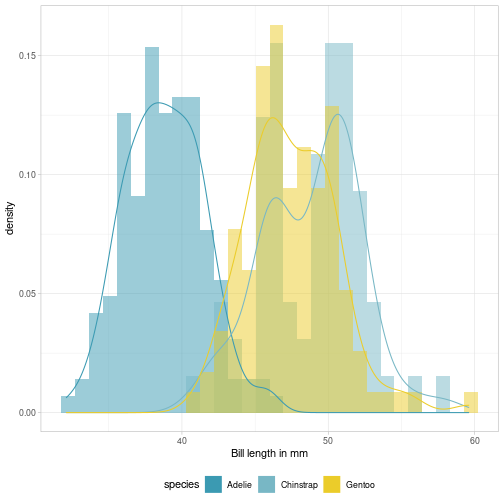<!-- --> --- template: useful_package count: false ```r ##install.packages('ggpubr') ggpubr::ggarrange(gg_p1, gg_p2, nrow=2, ncol = 1) ``` ``` ## Warning: Removed 2 rows containing missing values (geom_point). ``` ``` ## `stat_bin()` using `bins = 30`. Pick better value with `binwidth`. ``` ``` ## Warning: Removed 2 rows containing non-finite values (stat_bin). ``` ``` ## Warning: Removed 2 rows containing non-finite values (stat_density). ``` 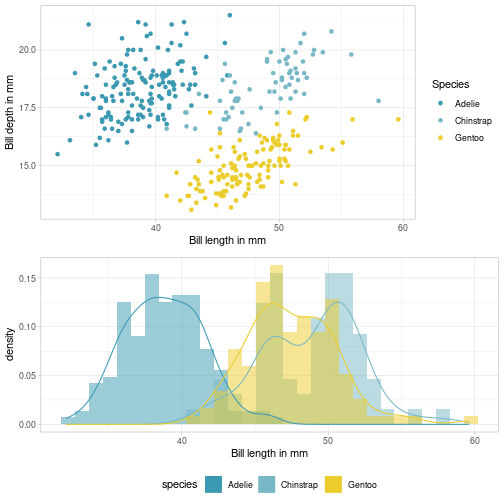<!-- --> --- template: useful_package count: false ```r ggpubr::ggarrange(gg_p1 + labs(x=''), gg_p2, nrow=2, ncol = 1, common.legend = TRUE) ``` ``` ## Warning: Removed 2 rows containing missing values (geom_point). ## Removed 2 rows containing missing values (geom_point). ``` ``` ## `stat_bin()` using `bins = 30`. Pick better value with `binwidth`. ``` ``` ## Warning: Removed 2 rows containing non-finite values (stat_bin). ``` ``` ## Warning: Removed 2 rows containing non-finite values (stat_density). ``` 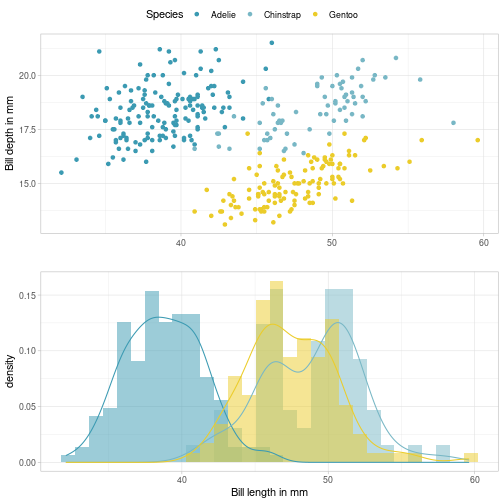<!-- --> --- name: bivariate_explore # Useful packages for publications/explorations The `GGally` package contains plenty of very useful and nice functions --- template: bivariate_explore count: false ```r ##install.packages('GGally') library(GGally) ``` ``` ## Warning: package 'GGally' was built under R version 4.0.5 ``` ``` ## Registered S3 method overwritten by 'GGally': ## method from ## +.gg ggplot2 ``` ```r penguins %>% ggpairs(columns = c(1,3,4,5), mapping = aes(col = species)) + scale_color_manual(values = wesanderson::wes_palette('Darjeeling1'))+ scale_fill_manual(values = wesanderson::wes_palette('Darjeeling1')) + theme(text = element_text(size = 6)) ``` ``` ## Warning in ggally_statistic(data = data, mapping = mapping, na.rm = na.rm, : ## Removed 2 rows containing missing values ``` ``` ## Warning in ggally_statistic(data = data, mapping = mapping, na.rm = na.rm, : ## Removed 2 rows containing missing values ## Warning in ggally_statistic(data = data, mapping = mapping, na.rm = na.rm, : ## Removed 2 rows containing missing values ``` ``` ## Warning: Removed 2 rows containing non-finite values (stat_boxplot). ## Removed 2 rows containing non-finite values (stat_boxplot). ## Removed 2 rows containing non-finite values (stat_boxplot). ``` ``` ## `stat_bin()` using `bins = 30`. Pick better value with `binwidth`. ``` ``` ## Warning: Removed 2 rows containing non-finite values (stat_bin). ``` ``` ## Warning: Removed 2 rows containing non-finite values (stat_density). ``` ``` ## `stat_bin()` using `bins = 30`. Pick better value with `binwidth`. ``` ``` ## Warning: Removed 2 rows containing non-finite values (stat_bin). ``` ``` ## Warning: Removed 2 rows containing missing values (geom_point). ``` ``` ## Warning: Removed 2 rows containing non-finite values (stat_density). ``` ``` ## `stat_bin()` using `bins = 30`. Pick better value with `binwidth`. ``` ``` ## Warning: Removed 2 rows containing non-finite values (stat_bin). ``` ``` ## Warning: Removed 2 rows containing missing values (geom_point). ## Removed 2 rows containing missing values (geom_point). ``` ``` ## Warning: Removed 2 rows containing non-finite values (stat_density). ``` 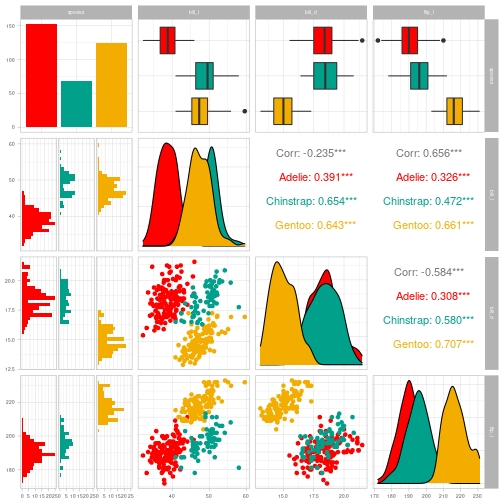<!-- --> --- template: bivariate_explore count: false ```r penguins %>% ggpairs(columns = c(1,3,4,5), mapping = aes(col = species), upper = list(continuous = wrap( "cor",size = 2)), lower = list(continuous = wrap('points', size = .5))) + scale_color_manual(values = wesanderson::wes_palette('Darjeeling1'))+ scale_fill_manual(values = wesanderson::wes_palette('Darjeeling1')) + theme(text = element_text(size = 6)) ``` ``` ## Warning in ggally_statistic(data = data, mapping = mapping, na.rm = na.rm, : ## Removed 2 rows containing missing values ## Warning in ggally_statistic(data = data, mapping = mapping, na.rm = na.rm, : ## Removed 2 rows containing missing values ## Warning in ggally_statistic(data = data, mapping = mapping, na.rm = na.rm, : ## Removed 2 rows containing missing values ``` ``` ## Warning: Removed 2 rows containing non-finite values (stat_boxplot). ## Removed 2 rows containing non-finite values (stat_boxplot). ## Removed 2 rows containing non-finite values (stat_boxplot). ``` ``` ## `stat_bin()` using `bins = 30`. Pick better value with `binwidth`. ``` ``` ## Warning: Removed 2 rows containing non-finite values (stat_bin). ``` ``` ## Warning: Removed 2 rows containing non-finite values (stat_density). ``` ``` ## `stat_bin()` using `bins = 30`. Pick better value with `binwidth`. ``` ``` ## Warning: Removed 2 rows containing non-finite values (stat_bin). ``` ``` ## Warning: Removed 2 rows containing missing values (geom_point). ``` ``` ## Warning: Removed 2 rows containing non-finite values (stat_density). ``` ``` ## `stat_bin()` using `bins = 30`. Pick better value with `binwidth`. ``` ``` ## Warning: Removed 2 rows containing non-finite values (stat_bin). ``` ``` ## Warning: Removed 2 rows containing missing values (geom_point). ## Removed 2 rows containing missing values (geom_point). ``` ``` ## Warning: Removed 2 rows containing non-finite values (stat_density). ``` 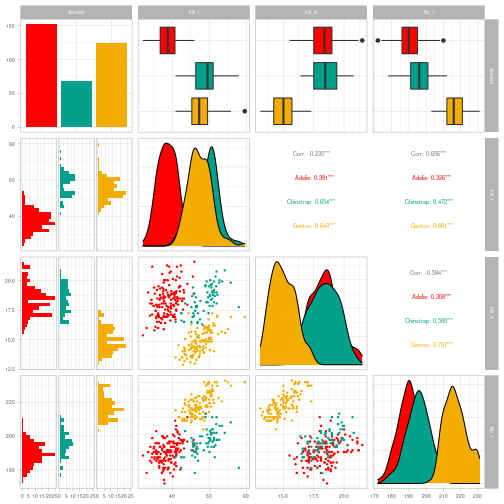<!-- --> --- name: gganimate # Useful packages for presentation The `gganimate` package produces animated graph (html only). ```r library(gganimate) gg + transition_states(year) + geom_text(x = 56 , y = 15, aes(label = as.character(year)), size = 8, col = "grey50") + theme(legend.position="bottom") ``` ``` ## Warning: Removed 1 rows containing missing values (geom_point). ## Removed 1 rows containing missing values (geom_point). ## Removed 1 rows containing missing values (geom_point). ## Removed 1 rows containing missing values (geom_point). ## Removed 1 rows containing missing values (geom_point). ## Removed 1 rows containing missing values (geom_point). ## Removed 1 rows containing missing values (geom_point). ## Removed 1 rows containing missing values (geom_point). ## Removed 1 rows containing missing values (geom_point). ## Removed 1 rows containing missing values (geom_point). ## Removed 1 rows containing missing values (geom_point). ## Removed 1 rows containing missing values (geom_point). ## Removed 1 rows containing missing values (geom_point). ## Removed 1 rows containing missing values (geom_point). ## Removed 1 rows containing missing values (geom_point). ## Removed 1 rows containing missing values (geom_point). ## Removed 1 rows containing missing values (geom_point). ## Removed 1 rows containing missing values (geom_point). ## Removed 1 rows containing missing values (geom_point). ## Removed 1 rows containing missing values (geom_point). ## Removed 1 rows containing missing values (geom_point). ## Removed 1 rows containing missing values (geom_point). ## Removed 1 rows containing missing values (geom_point). ## Removed 1 rows containing missing values (geom_point). ## Removed 1 rows containing missing values (geom_point). ## Removed 1 rows containing missing values (geom_point). ## Removed 1 rows containing missing values (geom_point). ## Removed 1 rows containing missing values (geom_point). ## Removed 1 rows containing missing values (geom_point). ## Removed 1 rows containing missing values (geom_point). ## Removed 1 rows containing missing values (geom_point). ## Removed 1 rows containing missing values (geom_point). ## Removed 1 rows containing missing values (geom_point). ## Removed 1 rows containing missing values (geom_point). ## Removed 1 rows containing missing values (geom_point). ## Removed 1 rows containing missing values (geom_point). ## Removed 1 rows containing missing values (geom_point). ## Removed 1 rows containing missing values (geom_point). ## Removed 1 rows containing missing values (geom_point). ## Removed 1 rows containing missing values (geom_point). ## Removed 1 rows containing missing values (geom_point). ## Removed 1 rows containing missing values (geom_point). ## Removed 1 rows containing missing values (geom_point). ## Removed 1 rows containing missing values (geom_point). ## Removed 1 rows containing missing values (geom_point). ## Removed 1 rows containing missing values (geom_point). ## Removed 1 rows containing missing values (geom_point). ## Removed 1 rows containing missing values (geom_point). ## Removed 1 rows containing missing values (geom_point). ## Removed 1 rows containing missing values (geom_point). ## Removed 1 rows containing missing values (geom_point). ## Removed 1 rows containing missing values (geom_point). ## Removed 1 rows containing missing values (geom_point). ## Removed 1 rows containing missing values (geom_point). ## Removed 1 rows containing missing values (geom_point). ## Removed 1 rows containing missing values (geom_point). ## Removed 1 rows containing missing values (geom_point). ## Removed 1 rows containing missing values (geom_point). ## Removed 1 rows containing missing values (geom_point). ## Removed 1 rows containing missing values (geom_point). ## Removed 1 rows containing missing values (geom_point). ## Removed 1 rows containing missing values (geom_point). ## Removed 1 rows containing missing values (geom_point). ## Removed 1 rows containing missing values (geom_point). ## Removed 1 rows containing missing values (geom_point). ## Removed 1 rows containing missing values (geom_point). ## Removed 1 rows containing missing values (geom_point). ## Removed 1 rows containing missing values (geom_point). ``` ``` ## Warning: Removed 2 rows containing missing values (geom_point). ## Removed 2 rows containing missing values (geom_point). ## Removed 2 rows containing missing values (geom_point). ## Removed 2 rows containing missing values (geom_point). ## Removed 2 rows containing missing values (geom_point). ## Removed 2 rows containing missing values (geom_point). ## Removed 2 rows containing missing values (geom_point). ## Removed 2 rows containing missing values (geom_point). ## Removed 2 rows containing missing values (geom_point). ## Removed 2 rows containing missing values (geom_point). ## Removed 2 rows containing missing values (geom_point). ## Removed 2 rows containing missing values (geom_point). ## Removed 2 rows containing missing values (geom_point). ## Removed 2 rows containing missing values (geom_point). ## Removed 2 rows containing missing values (geom_point). ``` 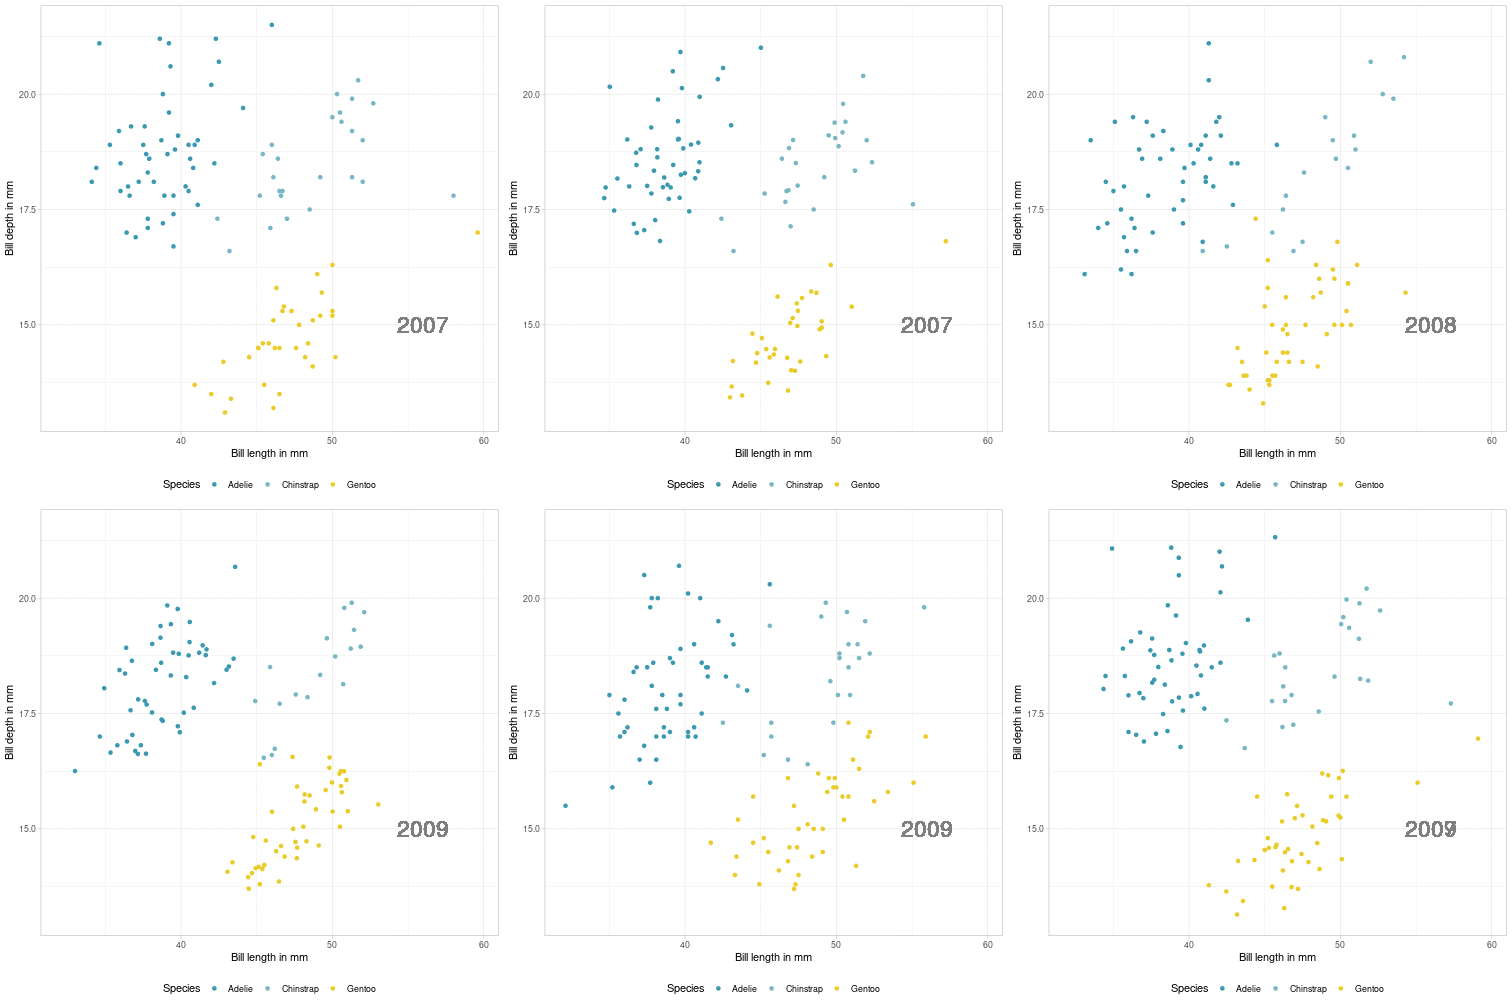<!-- --> --- name: plotly # Useful packages for online reporting The `plotly` package produces interactive plots (html only). ```r library(plotly) ``` ``` ## Warning: package 'plotly' was built under R version 4.0.5 ``` ``` ## ## Attaching package: 'plotly' ``` ``` ## The following object is masked from 'package:ggplot2': ## ## last_plot ``` ``` ## The following object is masked from 'package:stats': ## ## filter ``` ``` ## The following object is masked from 'package:graphics': ## ## layout ``` ```r gg %>% ggplotly() ``` <div id="htmlwidget-d569b0d11104322094d8" style="width:288px;height:360px;" class="plotly html-widget"></div> <script type="application/json" data-for="htmlwidget-d569b0d11104322094d8">{"x":{"data":[{"x":[39.1,39.5,40.3,null,36.7,39.3,38.9,39.2,34.1,42,37.8,37.8,41.1,38.6,34.6,36.6,38.7,42.5,34.4,46,37.8,37.7,35.9,38.2,38.8,35.3,40.6,40.5,37.9,40.5,39.5,37.2,39.5,40.9,36.4,39.2,38.8,42.2,37.6,39.8,36.5,40.8,36,44.1,37,39.6,41.1,37.5,36,42.3,39.6,40.1,35,42,34.5,41.4,39,40.6,36.5,37.6,35.7,41.3,37.6,41.1,36.4,41.6,35.5,41.1,35.9,41.8,33.5,39.7,39.6,45.8,35.5,42.8,40.9,37.2,36.2,42.1,34.6,42.9,36.7,35.1,37.3,41.3,36.3,36.9,38.3,38.9,35.7,41.1,34,39.6,36.2,40.8,38.1,40.3,33.1,43.2,35,41,37.7,37.8,37.9,39.7,38.6,38.2,38.1,43.2,38.1,45.6,39.7,42.2,39.6,42.7,38.6,37.3,35.7,41.1,36.2,37.7,40.2,41.4,35.2,40.6,38.8,41.5,39,44.1,38.5,43.1,36.8,37.5,38.1,41.1,35.6,40.2,37,39.7,40.2,40.6,32.1,40.7,37.3,39,39.2,36.6,36,37.8,36,41.5],"y":[18.7,17.4,18,null,19.3,20.6,17.8,19.6,18.1,20.2,17.1,17.3,17.6,21.2,21.1,17.8,19,20.7,18.4,21.5,18.3,18.7,19.2,18.1,17.2,18.9,18.6,17.9,18.6,18.9,16.7,18.1,17.8,18.9,17,21.1,20,18.5,19.3,19.1,18,18.4,18.5,19.7,16.9,18.8,19,18.9,17.9,21.2,17.7,18.9,17.9,19.5,18.1,18.6,17.5,18.8,16.6,19.1,16.9,21.1,17,18.2,17.1,18,16.2,19.1,16.6,19.4,19,18.4,17.2,18.9,17.5,18.5,16.8,19.4,16.1,19.1,17.2,17.6,18.8,19.4,17.8,20.3,19.5,18.6,19.2,18.8,18,18.1,17.1,18.1,17.3,18.9,18.6,18.5,16.1,18.5,17.9,20,16,20,18.6,18.9,17.2,20,17,19,16.5,20.3,17.7,19.5,20.7,18.3,17,20.5,17,18.6,17.2,19.8,17,18.5,15.9,19,17.6,18.3,17.1,18,17.9,19.2,18.5,18.5,17.6,17.5,17.5,20.1,16.5,17.9,17.1,17.2,15.5,17,16.8,18.7,18.6,18.4,17.8,18.1,17.1,18.5],"text":["species: Adelie<br />bill_l: 39.1<br />bill_d: 18.7","species: Adelie<br />bill_l: 39.5<br />bill_d: 17.4","species: Adelie<br />bill_l: 40.3<br />bill_d: 18.0","species: Adelie<br />bill_l: NA<br />bill_d: NA","species: Adelie<br />bill_l: 36.7<br />bill_d: 19.3","species: Adelie<br />bill_l: 39.3<br />bill_d: 20.6","species: Adelie<br />bill_l: 38.9<br />bill_d: 17.8","species: Adelie<br />bill_l: 39.2<br />bill_d: 19.6","species: Adelie<br />bill_l: 34.1<br />bill_d: 18.1","species: Adelie<br />bill_l: 42.0<br />bill_d: 20.2","species: Adelie<br />bill_l: 37.8<br />bill_d: 17.1","species: Adelie<br />bill_l: 37.8<br />bill_d: 17.3","species: Adelie<br />bill_l: 41.1<br />bill_d: 17.6","species: Adelie<br />bill_l: 38.6<br />bill_d: 21.2","species: Adelie<br />bill_l: 34.6<br />bill_d: 21.1","species: Adelie<br />bill_l: 36.6<br />bill_d: 17.8","species: Adelie<br />bill_l: 38.7<br />bill_d: 19.0","species: Adelie<br />bill_l: 42.5<br />bill_d: 20.7","species: Adelie<br />bill_l: 34.4<br />bill_d: 18.4","species: Adelie<br />bill_l: 46.0<br />bill_d: 21.5","species: Adelie<br />bill_l: 37.8<br />bill_d: 18.3","species: Adelie<br />bill_l: 37.7<br />bill_d: 18.7","species: Adelie<br />bill_l: 35.9<br />bill_d: 19.2","species: Adelie<br />bill_l: 38.2<br />bill_d: 18.1","species: Adelie<br />bill_l: 38.8<br />bill_d: 17.2","species: Adelie<br />bill_l: 35.3<br />bill_d: 18.9","species: Adelie<br />bill_l: 40.6<br />bill_d: 18.6","species: Adelie<br />bill_l: 40.5<br />bill_d: 17.9","species: Adelie<br />bill_l: 37.9<br />bill_d: 18.6","species: Adelie<br />bill_l: 40.5<br />bill_d: 18.9","species: Adelie<br />bill_l: 39.5<br />bill_d: 16.7","species: Adelie<br />bill_l: 37.2<br />bill_d: 18.1","species: Adelie<br />bill_l: 39.5<br />bill_d: 17.8","species: Adelie<br />bill_l: 40.9<br />bill_d: 18.9","species: Adelie<br />bill_l: 36.4<br />bill_d: 17.0","species: Adelie<br />bill_l: 39.2<br />bill_d: 21.1","species: Adelie<br />bill_l: 38.8<br />bill_d: 20.0","species: Adelie<br />bill_l: 42.2<br />bill_d: 18.5","species: Adelie<br />bill_l: 37.6<br />bill_d: 19.3","species: Adelie<br />bill_l: 39.8<br />bill_d: 19.1","species: Adelie<br />bill_l: 36.5<br />bill_d: 18.0","species: Adelie<br />bill_l: 40.8<br />bill_d: 18.4","species: Adelie<br />bill_l: 36.0<br />bill_d: 18.5","species: Adelie<br />bill_l: 44.1<br />bill_d: 19.7","species: Adelie<br />bill_l: 37.0<br />bill_d: 16.9","species: Adelie<br />bill_l: 39.6<br />bill_d: 18.8","species: Adelie<br />bill_l: 41.1<br />bill_d: 19.0","species: Adelie<br />bill_l: 37.5<br />bill_d: 18.9","species: Adelie<br />bill_l: 36.0<br />bill_d: 17.9","species: Adelie<br />bill_l: 42.3<br />bill_d: 21.2","species: Adelie<br />bill_l: 39.6<br />bill_d: 17.7","species: Adelie<br />bill_l: 40.1<br />bill_d: 18.9","species: Adelie<br />bill_l: 35.0<br />bill_d: 17.9","species: Adelie<br />bill_l: 42.0<br />bill_d: 19.5","species: Adelie<br />bill_l: 34.5<br />bill_d: 18.1","species: Adelie<br />bill_l: 41.4<br />bill_d: 18.6","species: Adelie<br />bill_l: 39.0<br />bill_d: 17.5","species: Adelie<br />bill_l: 40.6<br />bill_d: 18.8","species: Adelie<br />bill_l: 36.5<br />bill_d: 16.6","species: Adelie<br />bill_l: 37.6<br />bill_d: 19.1","species: Adelie<br />bill_l: 35.7<br />bill_d: 16.9","species: Adelie<br />bill_l: 41.3<br />bill_d: 21.1","species: Adelie<br />bill_l: 37.6<br />bill_d: 17.0","species: Adelie<br />bill_l: 41.1<br />bill_d: 18.2","species: Adelie<br />bill_l: 36.4<br />bill_d: 17.1","species: Adelie<br />bill_l: 41.6<br />bill_d: 18.0","species: Adelie<br />bill_l: 35.5<br />bill_d: 16.2","species: Adelie<br />bill_l: 41.1<br />bill_d: 19.1","species: Adelie<br />bill_l: 35.9<br />bill_d: 16.6","species: Adelie<br />bill_l: 41.8<br />bill_d: 19.4","species: Adelie<br />bill_l: 33.5<br />bill_d: 19.0","species: Adelie<br />bill_l: 39.7<br />bill_d: 18.4","species: Adelie<br />bill_l: 39.6<br />bill_d: 17.2","species: Adelie<br />bill_l: 45.8<br />bill_d: 18.9","species: Adelie<br />bill_l: 35.5<br />bill_d: 17.5","species: Adelie<br />bill_l: 42.8<br />bill_d: 18.5","species: Adelie<br />bill_l: 40.9<br />bill_d: 16.8","species: Adelie<br />bill_l: 37.2<br />bill_d: 19.4","species: Adelie<br />bill_l: 36.2<br />bill_d: 16.1","species: Adelie<br />bill_l: 42.1<br />bill_d: 19.1","species: Adelie<br />bill_l: 34.6<br />bill_d: 17.2","species: Adelie<br />bill_l: 42.9<br />bill_d: 17.6","species: Adelie<br />bill_l: 36.7<br />bill_d: 18.8","species: Adelie<br />bill_l: 35.1<br />bill_d: 19.4","species: Adelie<br />bill_l: 37.3<br />bill_d: 17.8","species: Adelie<br />bill_l: 41.3<br />bill_d: 20.3","species: Adelie<br />bill_l: 36.3<br />bill_d: 19.5","species: Adelie<br />bill_l: 36.9<br />bill_d: 18.6","species: Adelie<br />bill_l: 38.3<br />bill_d: 19.2","species: Adelie<br />bill_l: 38.9<br />bill_d: 18.8","species: Adelie<br />bill_l: 35.7<br />bill_d: 18.0","species: Adelie<br />bill_l: 41.1<br />bill_d: 18.1","species: Adelie<br />bill_l: 34.0<br />bill_d: 17.1","species: Adelie<br />bill_l: 39.6<br />bill_d: 18.1","species: Adelie<br />bill_l: 36.2<br />bill_d: 17.3","species: Adelie<br />bill_l: 40.8<br />bill_d: 18.9","species: Adelie<br />bill_l: 38.1<br />bill_d: 18.6","species: Adelie<br />bill_l: 40.3<br />bill_d: 18.5","species: Adelie<br />bill_l: 33.1<br />bill_d: 16.1","species: Adelie<br />bill_l: 43.2<br />bill_d: 18.5","species: Adelie<br />bill_l: 35.0<br />bill_d: 17.9","species: Adelie<br />bill_l: 41.0<br />bill_d: 20.0","species: Adelie<br />bill_l: 37.7<br />bill_d: 16.0","species: Adelie<br />bill_l: 37.8<br />bill_d: 20.0","species: Adelie<br />bill_l: 37.9<br />bill_d: 18.6","species: Adelie<br />bill_l: 39.7<br />bill_d: 18.9","species: Adelie<br />bill_l: 38.6<br />bill_d: 17.2","species: Adelie<br />bill_l: 38.2<br />bill_d: 20.0","species: Adelie<br />bill_l: 38.1<br />bill_d: 17.0","species: Adelie<br />bill_l: 43.2<br />bill_d: 19.0","species: Adelie<br />bill_l: 38.1<br />bill_d: 16.5","species: Adelie<br />bill_l: 45.6<br />bill_d: 20.3","species: Adelie<br />bill_l: 39.7<br />bill_d: 17.7","species: Adelie<br />bill_l: 42.2<br />bill_d: 19.5","species: Adelie<br />bill_l: 39.6<br />bill_d: 20.7","species: Adelie<br />bill_l: 42.7<br />bill_d: 18.3","species: Adelie<br />bill_l: 38.6<br />bill_d: 17.0","species: Adelie<br />bill_l: 37.3<br />bill_d: 20.5","species: Adelie<br />bill_l: 35.7<br />bill_d: 17.0","species: Adelie<br />bill_l: 41.1<br />bill_d: 18.6","species: Adelie<br />bill_l: 36.2<br />bill_d: 17.2","species: Adelie<br />bill_l: 37.7<br />bill_d: 19.8","species: Adelie<br />bill_l: 40.2<br />bill_d: 17.0","species: Adelie<br />bill_l: 41.4<br />bill_d: 18.5","species: Adelie<br />bill_l: 35.2<br />bill_d: 15.9","species: Adelie<br />bill_l: 40.6<br />bill_d: 19.0","species: Adelie<br />bill_l: 38.8<br />bill_d: 17.6","species: Adelie<br />bill_l: 41.5<br />bill_d: 18.3","species: Adelie<br />bill_l: 39.0<br />bill_d: 17.1","species: Adelie<br />bill_l: 44.1<br />bill_d: 18.0","species: Adelie<br />bill_l: 38.5<br />bill_d: 17.9","species: Adelie<br />bill_l: 43.1<br />bill_d: 19.2","species: Adelie<br />bill_l: 36.8<br />bill_d: 18.5","species: Adelie<br />bill_l: 37.5<br />bill_d: 18.5","species: Adelie<br />bill_l: 38.1<br />bill_d: 17.6","species: Adelie<br />bill_l: 41.1<br />bill_d: 17.5","species: Adelie<br />bill_l: 35.6<br />bill_d: 17.5","species: Adelie<br />bill_l: 40.2<br />bill_d: 20.1","species: Adelie<br />bill_l: 37.0<br />bill_d: 16.5","species: Adelie<br />bill_l: 39.7<br />bill_d: 17.9","species: Adelie<br />bill_l: 40.2<br />bill_d: 17.1","species: Adelie<br />bill_l: 40.6<br />bill_d: 17.2","species: Adelie<br />bill_l: 32.1<br />bill_d: 15.5","species: Adelie<br />bill_l: 40.7<br />bill_d: 17.0","species: Adelie<br />bill_l: 37.3<br />bill_d: 16.8","species: Adelie<br />bill_l: 39.0<br />bill_d: 18.7","species: Adelie<br />bill_l: 39.2<br />bill_d: 18.6","species: Adelie<br />bill_l: 36.6<br />bill_d: 18.4","species: Adelie<br />bill_l: 36.0<br />bill_d: 17.8","species: Adelie<br />bill_l: 37.8<br />bill_d: 18.1","species: Adelie<br />bill_l: 36.0<br />bill_d: 17.1","species: Adelie<br />bill_l: 41.5<br />bill_d: 18.5"],"type":"scatter","mode":"markers","marker":{"autocolorscale":false,"color":"rgba(59,154,178,1)","opacity":1,"size":5.66929133858268,"symbol":"circle","line":{"width":1.88976377952756,"color":"rgba(59,154,178,1)"}},"hoveron":"points","name":"Adelie","legendgroup":"Adelie","showlegend":true,"xaxis":"x","yaxis":"y","hoverinfo":"text","frame":null},{"x":[46.5,50,51.3,45.4,52.7,45.2,46.1,51.3,46,51.3,46.6,51.7,47,52,45.9,50.5,50.3,58,46.4,49.2,42.4,48.5,43.2,50.6,46.7,52,50.5,49.5,46.4,52.8,40.9,54.2,42.5,51,49.7,47.5,47.6,52,46.9,53.5,49,46.2,50.9,45.5,50.9,50.8,50.1,49,51.5,49.8,48.1,51.4,45.7,50.7,42.5,52.2,45.2,49.3,50.2,45.6,51.9,46.8,45.7,55.8,43.5,49.6,50.8,50.2],"y":[17.9,19.5,19.2,18.7,19.8,17.8,18.2,18.2,18.9,19.9,17.8,20.3,17.3,18.1,17.1,19.6,20,17.8,18.6,18.2,17.3,17.5,16.6,19.4,17.9,19,18.4,19,17.8,20,16.6,20.8,16.7,18.8,18.6,16.8,18.3,20.7,16.6,19.9,19.5,17.5,19.1,17,17.9,18.5,17.9,19.6,18.7,17.3,16.4,19,17.3,19.7,17.3,18.8,16.6,19.9,18.8,19.4,19.5,16.5,17,19.8,18.1,18.2,19,18.7],"text":["species: Chinstrap<br />bill_l: 46.5<br />bill_d: 17.9","species: Chinstrap<br />bill_l: 50.0<br />bill_d: 19.5","species: Chinstrap<br />bill_l: 51.3<br />bill_d: 19.2","species: Chinstrap<br />bill_l: 45.4<br />bill_d: 18.7","species: Chinstrap<br />bill_l: 52.7<br />bill_d: 19.8","species: Chinstrap<br />bill_l: 45.2<br />bill_d: 17.8","species: Chinstrap<br />bill_l: 46.1<br />bill_d: 18.2","species: Chinstrap<br />bill_l: 51.3<br />bill_d: 18.2","species: Chinstrap<br />bill_l: 46.0<br />bill_d: 18.9","species: Chinstrap<br />bill_l: 51.3<br />bill_d: 19.9","species: Chinstrap<br />bill_l: 46.6<br />bill_d: 17.8","species: Chinstrap<br />bill_l: 51.7<br />bill_d: 20.3","species: Chinstrap<br />bill_l: 47.0<br />bill_d: 17.3","species: Chinstrap<br />bill_l: 52.0<br />bill_d: 18.1","species: Chinstrap<br />bill_l: 45.9<br />bill_d: 17.1","species: Chinstrap<br />bill_l: 50.5<br />bill_d: 19.6","species: Chinstrap<br />bill_l: 50.3<br />bill_d: 20.0","species: Chinstrap<br />bill_l: 58.0<br />bill_d: 17.8","species: Chinstrap<br />bill_l: 46.4<br />bill_d: 18.6","species: Chinstrap<br />bill_l: 49.2<br />bill_d: 18.2","species: Chinstrap<br />bill_l: 42.4<br />bill_d: 17.3","species: Chinstrap<br />bill_l: 48.5<br />bill_d: 17.5","species: Chinstrap<br />bill_l: 43.2<br />bill_d: 16.6","species: Chinstrap<br />bill_l: 50.6<br />bill_d: 19.4","species: Chinstrap<br />bill_l: 46.7<br />bill_d: 17.9","species: Chinstrap<br />bill_l: 52.0<br />bill_d: 19.0","species: Chinstrap<br />bill_l: 50.5<br />bill_d: 18.4","species: Chinstrap<br />bill_l: 49.5<br />bill_d: 19.0","species: Chinstrap<br />bill_l: 46.4<br />bill_d: 17.8","species: Chinstrap<br />bill_l: 52.8<br />bill_d: 20.0","species: Chinstrap<br />bill_l: 40.9<br />bill_d: 16.6","species: Chinstrap<br />bill_l: 54.2<br />bill_d: 20.8","species: Chinstrap<br />bill_l: 42.5<br />bill_d: 16.7","species: Chinstrap<br />bill_l: 51.0<br />bill_d: 18.8","species: Chinstrap<br />bill_l: 49.7<br />bill_d: 18.6","species: Chinstrap<br />bill_l: 47.5<br />bill_d: 16.8","species: Chinstrap<br />bill_l: 47.6<br />bill_d: 18.3","species: Chinstrap<br />bill_l: 52.0<br />bill_d: 20.7","species: Chinstrap<br />bill_l: 46.9<br />bill_d: 16.6","species: Chinstrap<br />bill_l: 53.5<br />bill_d: 19.9","species: Chinstrap<br />bill_l: 49.0<br />bill_d: 19.5","species: Chinstrap<br />bill_l: 46.2<br />bill_d: 17.5","species: Chinstrap<br />bill_l: 50.9<br />bill_d: 19.1","species: Chinstrap<br />bill_l: 45.5<br />bill_d: 17.0","species: Chinstrap<br />bill_l: 50.9<br />bill_d: 17.9","species: Chinstrap<br />bill_l: 50.8<br />bill_d: 18.5","species: Chinstrap<br />bill_l: 50.1<br />bill_d: 17.9","species: Chinstrap<br />bill_l: 49.0<br />bill_d: 19.6","species: Chinstrap<br />bill_l: 51.5<br />bill_d: 18.7","species: Chinstrap<br />bill_l: 49.8<br />bill_d: 17.3","species: Chinstrap<br />bill_l: 48.1<br />bill_d: 16.4","species: Chinstrap<br />bill_l: 51.4<br />bill_d: 19.0","species: Chinstrap<br />bill_l: 45.7<br />bill_d: 17.3","species: Chinstrap<br />bill_l: 50.7<br />bill_d: 19.7","species: Chinstrap<br />bill_l: 42.5<br />bill_d: 17.3","species: Chinstrap<br />bill_l: 52.2<br />bill_d: 18.8","species: Chinstrap<br />bill_l: 45.2<br />bill_d: 16.6","species: Chinstrap<br />bill_l: 49.3<br />bill_d: 19.9","species: Chinstrap<br />bill_l: 50.2<br />bill_d: 18.8","species: Chinstrap<br />bill_l: 45.6<br />bill_d: 19.4","species: Chinstrap<br />bill_l: 51.9<br />bill_d: 19.5","species: Chinstrap<br />bill_l: 46.8<br />bill_d: 16.5","species: Chinstrap<br />bill_l: 45.7<br />bill_d: 17.0","species: Chinstrap<br />bill_l: 55.8<br />bill_d: 19.8","species: Chinstrap<br />bill_l: 43.5<br />bill_d: 18.1","species: Chinstrap<br />bill_l: 49.6<br />bill_d: 18.2","species: Chinstrap<br />bill_l: 50.8<br />bill_d: 19.0","species: Chinstrap<br />bill_l: 50.2<br />bill_d: 18.7"],"type":"scatter","mode":"markers","marker":{"autocolorscale":false,"color":"rgba(120,183,197,1)","opacity":1,"size":5.66929133858268,"symbol":"circle","line":{"width":1.88976377952756,"color":"rgba(120,183,197,1)"}},"hoveron":"points","name":"Chinstrap","legendgroup":"Chinstrap","showlegend":true,"xaxis":"x","yaxis":"y","hoverinfo":"text","frame":null},{"x":[46.1,50,48.7,50,47.6,46.5,45.4,46.7,43.3,46.8,40.9,49,45.5,48.4,45.8,49.3,42,49.2,46.2,48.7,50.2,45.1,46.5,46.3,42.9,46.1,44.5,47.8,48.2,50,47.3,42.8,45.1,59.6,49.1,48.4,42.6,44.4,44,48.7,42.7,49.6,45.3,49.6,50.5,43.6,45.5,50.5,44.9,45.2,46.6,48.5,45.1,50.1,46.5,45,43.8,45.5,43.2,50.4,45.3,46.2,45.7,54.3,45.8,49.8,46.2,49.5,43.5,50.7,47.7,46.4,48.2,46.5,46.4,48.6,47.5,51.1,45.2,45.2,49.1,52.5,47.4,50,44.9,50.8,43.4,51.3,47.5,52.1,47.5,52.2,45.5,49.5,44.5,50.8,49.4,46.9,48.4,51.1,48.5,55.9,47.2,49.1,47.3,46.8,41.7,53.4,43.3,48.1,50.5,49.8,43.5,51.5,46.2,55.1,44.5,48.8,47.2,null,46.8,50.4,45.2,49.9],"y":[13.2,16.3,14.1,15.2,14.5,13.5,14.6,15.3,13.4,15.4,13.7,16.1,13.7,14.6,14.6,15.7,13.5,15.2,14.5,15.1,14.3,14.5,14.5,15.8,13.1,15.1,14.3,15,14.3,15.3,15.3,14.2,14.5,17,14.8,16.3,13.7,17.3,13.6,15.7,13.7,16,13.7,15,15.9,13.9,13.9,15.9,13.3,15.8,14.2,14.1,14.4,15,14.4,15.4,13.9,15,14.5,15.3,13.8,14.9,13.9,15.7,14.2,16.8,14.4,16.2,14.2,15,15,15.6,15.6,14.8,15,16,14.2,16.3,13.8,16.4,14.5,15.6,14.6,15.9,13.8,17.3,14.4,14.2,14,17,15,17.1,14.5,16.1,14.7,15.7,15.8,14.6,14.4,16.5,15,17,15.5,15,13.8,16.1,14.7,15.8,14,15.1,15.2,15.9,15.2,16.3,14.1,16,15.7,16.2,13.7,null,14.3,15.7,14.8,16.1],"text":["species: Gentoo<br />bill_l: 46.1<br />bill_d: 13.2","species: Gentoo<br />bill_l: 50.0<br />bill_d: 16.3","species: Gentoo<br />bill_l: 48.7<br />bill_d: 14.1","species: Gentoo<br />bill_l: 50.0<br />bill_d: 15.2","species: Gentoo<br />bill_l: 47.6<br />bill_d: 14.5","species: Gentoo<br />bill_l: 46.5<br />bill_d: 13.5","species: Gentoo<br />bill_l: 45.4<br />bill_d: 14.6","species: Gentoo<br />bill_l: 46.7<br />bill_d: 15.3","species: Gentoo<br />bill_l: 43.3<br />bill_d: 13.4","species: Gentoo<br />bill_l: 46.8<br />bill_d: 15.4","species: Gentoo<br />bill_l: 40.9<br />bill_d: 13.7","species: Gentoo<br />bill_l: 49.0<br />bill_d: 16.1","species: Gentoo<br />bill_l: 45.5<br />bill_d: 13.7","species: Gentoo<br />bill_l: 48.4<br />bill_d: 14.6","species: Gentoo<br />bill_l: 45.8<br />bill_d: 14.6","species: Gentoo<br />bill_l: 49.3<br />bill_d: 15.7","species: Gentoo<br />bill_l: 42.0<br />bill_d: 13.5","species: Gentoo<br />bill_l: 49.2<br />bill_d: 15.2","species: Gentoo<br />bill_l: 46.2<br />bill_d: 14.5","species: Gentoo<br />bill_l: 48.7<br />bill_d: 15.1","species: Gentoo<br />bill_l: 50.2<br />bill_d: 14.3","species: Gentoo<br />bill_l: 45.1<br />bill_d: 14.5","species: Gentoo<br />bill_l: 46.5<br />bill_d: 14.5","species: Gentoo<br />bill_l: 46.3<br />bill_d: 15.8","species: Gentoo<br />bill_l: 42.9<br />bill_d: 13.1","species: Gentoo<br />bill_l: 46.1<br />bill_d: 15.1","species: Gentoo<br />bill_l: 44.5<br />bill_d: 14.3","species: Gentoo<br />bill_l: 47.8<br />bill_d: 15.0","species: Gentoo<br />bill_l: 48.2<br />bill_d: 14.3","species: Gentoo<br />bill_l: 50.0<br />bill_d: 15.3","species: Gentoo<br />bill_l: 47.3<br />bill_d: 15.3","species: Gentoo<br />bill_l: 42.8<br />bill_d: 14.2","species: Gentoo<br />bill_l: 45.1<br />bill_d: 14.5","species: Gentoo<br />bill_l: 59.6<br />bill_d: 17.0","species: Gentoo<br />bill_l: 49.1<br />bill_d: 14.8","species: Gentoo<br />bill_l: 48.4<br />bill_d: 16.3","species: Gentoo<br />bill_l: 42.6<br />bill_d: 13.7","species: Gentoo<br />bill_l: 44.4<br />bill_d: 17.3","species: Gentoo<br />bill_l: 44.0<br />bill_d: 13.6","species: Gentoo<br />bill_l: 48.7<br />bill_d: 15.7","species: Gentoo<br />bill_l: 42.7<br />bill_d: 13.7","species: Gentoo<br />bill_l: 49.6<br />bill_d: 16.0","species: Gentoo<br />bill_l: 45.3<br />bill_d: 13.7","species: Gentoo<br />bill_l: 49.6<br />bill_d: 15.0","species: Gentoo<br />bill_l: 50.5<br />bill_d: 15.9","species: Gentoo<br />bill_l: 43.6<br />bill_d: 13.9","species: Gentoo<br />bill_l: 45.5<br />bill_d: 13.9","species: Gentoo<br />bill_l: 50.5<br />bill_d: 15.9","species: Gentoo<br />bill_l: 44.9<br />bill_d: 13.3","species: Gentoo<br />bill_l: 45.2<br />bill_d: 15.8","species: Gentoo<br />bill_l: 46.6<br />bill_d: 14.2","species: Gentoo<br />bill_l: 48.5<br />bill_d: 14.1","species: Gentoo<br />bill_l: 45.1<br />bill_d: 14.4","species: Gentoo<br />bill_l: 50.1<br />bill_d: 15.0","species: Gentoo<br />bill_l: 46.5<br />bill_d: 14.4","species: Gentoo<br />bill_l: 45.0<br />bill_d: 15.4","species: Gentoo<br />bill_l: 43.8<br />bill_d: 13.9","species: Gentoo<br />bill_l: 45.5<br />bill_d: 15.0","species: Gentoo<br />bill_l: 43.2<br />bill_d: 14.5","species: Gentoo<br />bill_l: 50.4<br />bill_d: 15.3","species: Gentoo<br />bill_l: 45.3<br />bill_d: 13.8","species: Gentoo<br />bill_l: 46.2<br />bill_d: 14.9","species: Gentoo<br />bill_l: 45.7<br />bill_d: 13.9","species: Gentoo<br />bill_l: 54.3<br />bill_d: 15.7","species: Gentoo<br />bill_l: 45.8<br />bill_d: 14.2","species: Gentoo<br />bill_l: 49.8<br />bill_d: 16.8","species: Gentoo<br />bill_l: 46.2<br />bill_d: 14.4","species: Gentoo<br />bill_l: 49.5<br />bill_d: 16.2","species: Gentoo<br />bill_l: 43.5<br />bill_d: 14.2","species: Gentoo<br />bill_l: 50.7<br />bill_d: 15.0","species: Gentoo<br />bill_l: 47.7<br />bill_d: 15.0","species: Gentoo<br />bill_l: 46.4<br />bill_d: 15.6","species: Gentoo<br />bill_l: 48.2<br />bill_d: 15.6","species: Gentoo<br />bill_l: 46.5<br />bill_d: 14.8","species: Gentoo<br />bill_l: 46.4<br />bill_d: 15.0","species: Gentoo<br />bill_l: 48.6<br />bill_d: 16.0","species: Gentoo<br />bill_l: 47.5<br />bill_d: 14.2","species: Gentoo<br />bill_l: 51.1<br />bill_d: 16.3","species: Gentoo<br />bill_l: 45.2<br />bill_d: 13.8","species: Gentoo<br />bill_l: 45.2<br />bill_d: 16.4","species: Gentoo<br />bill_l: 49.1<br />bill_d: 14.5","species: Gentoo<br />bill_l: 52.5<br />bill_d: 15.6","species: Gentoo<br />bill_l: 47.4<br />bill_d: 14.6","species: Gentoo<br />bill_l: 50.0<br />bill_d: 15.9","species: Gentoo<br />bill_l: 44.9<br />bill_d: 13.8","species: Gentoo<br />bill_l: 50.8<br />bill_d: 17.3","species: Gentoo<br />bill_l: 43.4<br />bill_d: 14.4","species: Gentoo<br />bill_l: 51.3<br />bill_d: 14.2","species: Gentoo<br />bill_l: 47.5<br />bill_d: 14.0","species: Gentoo<br />bill_l: 52.1<br />bill_d: 17.0","species: Gentoo<br />bill_l: 47.5<br />bill_d: 15.0","species: Gentoo<br />bill_l: 52.2<br />bill_d: 17.1","species: Gentoo<br />bill_l: 45.5<br />bill_d: 14.5","species: Gentoo<br />bill_l: 49.5<br />bill_d: 16.1","species: Gentoo<br />bill_l: 44.5<br />bill_d: 14.7","species: Gentoo<br />bill_l: 50.8<br />bill_d: 15.7","species: Gentoo<br />bill_l: 49.4<br />bill_d: 15.8","species: Gentoo<br />bill_l: 46.9<br />bill_d: 14.6","species: Gentoo<br />bill_l: 48.4<br />bill_d: 14.4","species: Gentoo<br />bill_l: 51.1<br />bill_d: 16.5","species: Gentoo<br />bill_l: 48.5<br />bill_d: 15.0","species: Gentoo<br />bill_l: 55.9<br />bill_d: 17.0","species: Gentoo<br />bill_l: 47.2<br />bill_d: 15.5","species: Gentoo<br />bill_l: 49.1<br />bill_d: 15.0","species: Gentoo<br />bill_l: 47.3<br />bill_d: 13.8","species: Gentoo<br />bill_l: 46.8<br />bill_d: 16.1","species: Gentoo<br />bill_l: 41.7<br />bill_d: 14.7","species: Gentoo<br />bill_l: 53.4<br />bill_d: 15.8","species: Gentoo<br />bill_l: 43.3<br />bill_d: 14.0","species: Gentoo<br />bill_l: 48.1<br />bill_d: 15.1","species: Gentoo<br />bill_l: 50.5<br />bill_d: 15.2","species: Gentoo<br />bill_l: 49.8<br />bill_d: 15.9","species: Gentoo<br />bill_l: 43.5<br />bill_d: 15.2","species: Gentoo<br />bill_l: 51.5<br />bill_d: 16.3","species: Gentoo<br />bill_l: 46.2<br />bill_d: 14.1","species: Gentoo<br />bill_l: 55.1<br />bill_d: 16.0","species: Gentoo<br />bill_l: 44.5<br />bill_d: 15.7","species: Gentoo<br />bill_l: 48.8<br />bill_d: 16.2","species: Gentoo<br />bill_l: 47.2<br />bill_d: 13.7","species: Gentoo<br />bill_l: NA<br />bill_d: NA","species: Gentoo<br />bill_l: 46.8<br />bill_d: 14.3","species: Gentoo<br />bill_l: 50.4<br />bill_d: 15.7","species: Gentoo<br />bill_l: 45.2<br />bill_d: 14.8","species: Gentoo<br />bill_l: 49.9<br />bill_d: 16.1"],"type":"scatter","mode":"markers","marker":{"autocolorscale":false,"color":"rgba(235,204,42,1)","opacity":1,"size":5.66929133858268,"symbol":"circle","line":{"width":1.88976377952756,"color":"rgba(235,204,42,1)"}},"hoveron":"points","name":"Gentoo","legendgroup":"Gentoo","showlegend":true,"xaxis":"x","yaxis":"y","hoverinfo":"text","frame":null}],"layout":{"margin":{"t":21.8447488584475,"r":7.30593607305936,"b":35.7990867579909,"l":48.9497716894977},"plot_bgcolor":"rgba(255,255,255,1)","paper_bgcolor":"rgba(255,255,255,1)","font":{"color":"rgba(0,0,0,1)","family":"","size":14.6118721461187},"xaxis":{"domain":[0,1],"automargin":true,"type":"linear","autorange":false,"range":[30.725,60.975],"tickmode":"array","ticktext":["40","50","60"],"tickvals":[40,50,60],"categoryorder":"array","categoryarray":["40","50","60"],"nticks":null,"ticks":"outside","tickcolor":"rgba(179,179,179,1)","ticklen":3.65296803652968,"tickwidth":0.33208800332088,"showticklabels":true,"tickfont":{"color":"rgba(77,77,77,1)","family":"","size":11.689497716895},"tickangle":-0,"showline":false,"linecolor":null,"linewidth":0,"showgrid":true,"gridcolor":"rgba(222,222,222,1)","gridwidth":0.33208800332088,"zeroline":false,"anchor":"y","title":{"text":"Bill length in mm","font":{"color":"rgba(0,0,0,1)","family":"","size":14.6118721461187}},"hoverformat":".2f"},"yaxis":{"domain":[0,1],"automargin":true,"type":"linear","autorange":false,"range":[12.68,21.92],"tickmode":"array","ticktext":["15.0","17.5","20.0"],"tickvals":[15,17.5,20],"categoryorder":"array","categoryarray":["15.0","17.5","20.0"],"nticks":null,"ticks":"outside","tickcolor":"rgba(179,179,179,1)","ticklen":3.65296803652968,"tickwidth":0.33208800332088,"showticklabels":true,"tickfont":{"color":"rgba(77,77,77,1)","family":"","size":11.689497716895},"tickangle":-0,"showline":false,"linecolor":null,"linewidth":0,"showgrid":true,"gridcolor":"rgba(222,222,222,1)","gridwidth":0.33208800332088,"zeroline":false,"anchor":"x","title":{"text":"Bill depth in mm","font":{"color":"rgba(0,0,0,1)","family":"","size":14.6118721461187}},"hoverformat":".2f"},"shapes":[{"type":"rect","fillcolor":"transparent","line":{"color":"rgba(179,179,179,1)","width":0.66417600664176,"linetype":"solid"},"yref":"paper","xref":"paper","x0":0,"x1":1,"y0":0,"y1":1}],"showlegend":true,"legend":{"bgcolor":"rgba(255,255,255,1)","bordercolor":"transparent","borderwidth":1.88976377952756,"font":{"color":"rgba(0,0,0,1)","family":"","size":11.689497716895},"title":{"text":"Species","font":{"color":"rgba(0,0,0,1)","family":"","size":14.6118721461187}}},"hovermode":"closest","barmode":"relative"},"config":{"doubleClick":"reset","modeBarButtonsToAdd":["hoverclosest","hovercompare"],"showSendToCloud":false},"source":"A","attrs":{"18813c996c1":{"colour":{},"x":{},"y":{},"type":"scatter"}},"cur_data":"18813c996c1","visdat":{"18813c996c1":["function (y) ","x"]},"highlight":{"on":"plotly_click","persistent":false,"dynamic":false,"selectize":false,"opacityDim":0.2,"selected":{"opacity":1},"debounce":0},"shinyEvents":["plotly_hover","plotly_click","plotly_selected","plotly_relayout","plotly_brushed","plotly_brushing","plotly_clickannotation","plotly_doubleclick","plotly_deselect","plotly_afterplot","plotly_sunburstclick"],"base_url":"https://plot.ly"},"evals":[],"jsHooks":[]}</script> --- # Inspiring websites - [R Graph Gallery](https://www.r-graph-gallery.com/) - [Top50 ggplot Visualisation](http://r-statistics.co/Top50-Ggplot2-Visualizations-MasterList-R-Code.html) --- # References Pebesma, E. (2018). "Simple Features for R: Standardized Support for Spatial Vector Data". In: _The R Journal_ 10.1, pp. 439-446. DOI: [10.32614/RJ-2018-009](https://doi.org/10.32614%2FRJ-2018-009). URL: [https://doi.org/10.32614/RJ-2018-009](https://doi.org/10.32614/RJ-2018-009). Wickham, H. (2016). _ggplot2: elegant graphics for data analysis_. Springer. URL: [https://ggplot2-book.org/](https://ggplot2-book.org/). Wickham, H. and G. Grolemund (2017). _R for Data Science: Import, Tidy, Transform, Visualize, and Model Data_. O'Reilly Media. URL: [http://r4ds.had.co.nz/](http://r4ds.had.co.nz/).